19 results
Preschool graphing handout microsofts
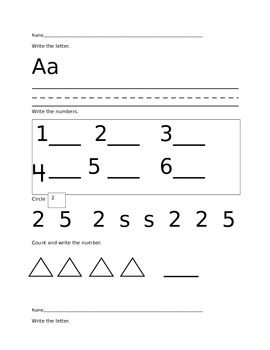
Kindergarten Common Core Test Prep/ Morning Work/ Workshop/ Independent Work
These handouts will reinforce concepts essential for kindergarteners to learn. The student will practice numbers to 100, the alphabet, patterns, telling time, graphs, high frequency words, sentence practice, months of the year, days of the week, solid and flat shapes, measurement, addition, subtraction, and counting objects. These handouts could be used during workshop, as morning or independent work.
Subjects:
Grades:
PreK - 1st
Types:
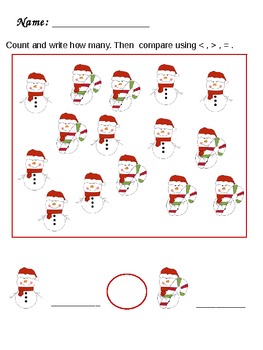
Christmas Math PreK-1st
Christmas Math
* 2 Graphing Activities and Recording Sheets (The students will count and graph the number of objects. Then they will Compare the numbers.This can be used as a hard copy for each child to complete or laminate the graphs and put in a center. Then each child can fill out the half sheet to record their graphing.)
* Santa Number Cards 1-10 ( Can be used with Number Talks or use them in a Math center to count and match the number)
* 2 Activities to Count and Compare
* 3 Activities
Subjects:
Grades:
PreK - 1st
Types:
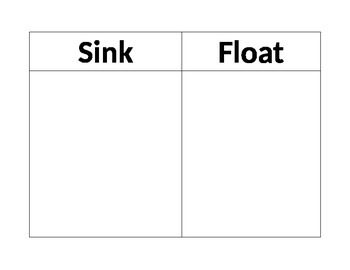
Sink or Float
This a sink or float form with six pictures of items to be used in the experiment. After the students does the experiment they cut out the pictues and glue them under the sink or float column.
Subjects:
Grades:
PreK - 1st
Types:

Inquiry Unit PowerPoint
This 41 slide Inquiry Unit PowerPoint comes complete with a hyperlinked main menu: Scientific InstrumentsSpring ScaleTriple Beam BalanceBarometerSling psychrometer Scientific Investigation QuantitativeQualitativeInferenceCompiling DataData TableIndependent VariablesDependent VariablesGraphsPictographBar CircleLineDrawing a Line GraphInterpreting a GraphClassifying Objects and OrganismsDichotomous KeyTechnological DesignControlled ExperimentLab SafetySymbolsScenarios
Subjects:
Grades:
PreK - 12th, Higher Education, Adult Education
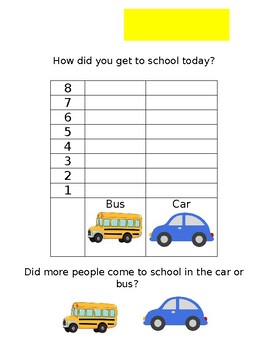
How Did You Get to School Today? Graph
Perfect beginning of the school year simple math activity for small group instruction or self-contained whole group instruction. Ask the students how they got to school (bus or car) and graph their results. Emphasize the concept of 'more' by asking students to identify which result had more.
Subjects:
Grades:
PreK - 2nd
Types:
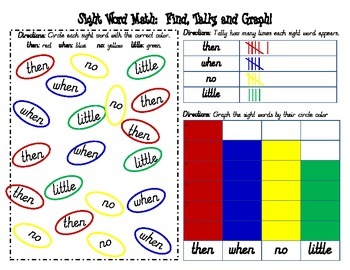
Sight Word Math Activity
This sight word math activity allows learning across curriculum. Students will get practice with identifying sight words as well as math concepts (graphing and tally marks). This document can be edited to fit your personal sight word list. My class uses this document weekly, with the words and the colors being changed to keep my kiddos on their toes!
Grades:
PreK - 1st
Types:
Sight Word Search and Graph
Use this activity to help kiddos practice their sight words! Kiddos will search and graph how many times they see a certain sight word in the box. This activity is great for word work and will also help with graphing skills!
Subjects:
Grades:
PreK - 1st
Types:
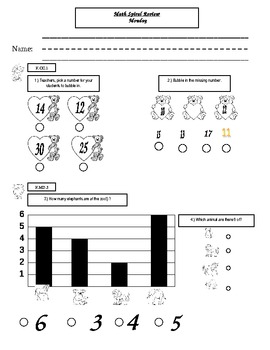
Math Morning/Bell/Daily work Common Core
Teachers have you tested your students at end of the year and they have forgotten the things you taught them since the beginning of the yea? Spirals are the fix to your problems. Spirals are used daily and are Common Core based questions in the form of worksheets. (Yes there are some good Common Core Stuff in here ) By doing these worksheets daily you give students an opportunity practice concepts daily so they remember what you have taught them, even if I was back in August. What is neat abou
Grades:
PreK - 2nd
Types:
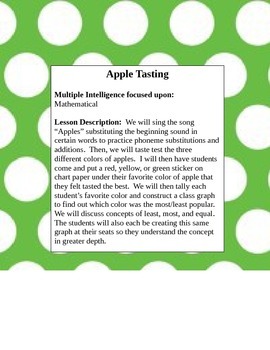
Apple Lessons
These are two apple lessons with lesson plans included in word format. The first is an apple graph worksheet I made to help students graph the class’ favorite kind of apple. The second goes along with the Dr. Suess story “Ten Apples up on Top”.
Printables---Apple Unit---Lesson Plans
Grades:
PreK - 1st
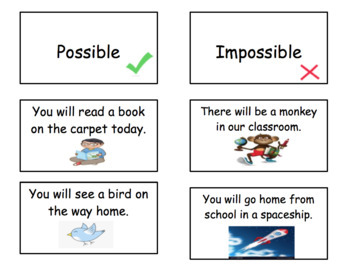
Probability Package
Worksheets for numeracy centres. Great for anchor charts, assessments, etc.
Grades:
PreK - 1st
Types:
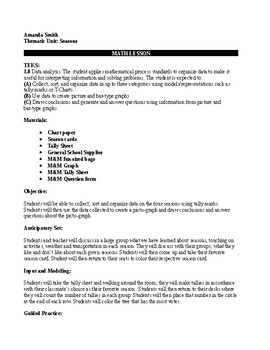
Math Graphing Lesson
This is a math graphing lesson from my seasons unit. It includes m&m graphing. Feel free to use what you want and leave the rest!
Subjects:
Grades:
PreK - 2nd
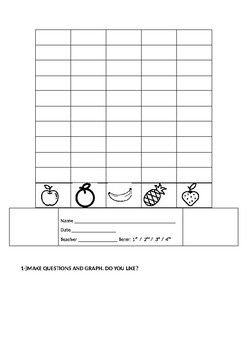
fruit graph
The idea in this worksheet is teaching and practice with kids making questions and talk about they like and what they don't.
DO YOU LIKE?
Subjects:
Grades:
PreK - 1st
Types:

Count and Graph
Your preschooler(s) can practice counting (numbers 1-5) and graphing. Child will count the images and color that many squares in the graph. Also has questions at the end about the graph (greatest, least, the same).
Grades:
PreK - K
Types:

Down on the Farm-Learning About Animals Handout 2
This handout is used to assess students' learning. Students will graph the number of legs on each farm animal and identify the most or fewest in the graph.
Grades:
PreK - 1st
Types:
Halloween Graph Handout
Give your students practice making a graph using this fun Halloween scene.
Grades:
PreK - 2nd
Types:
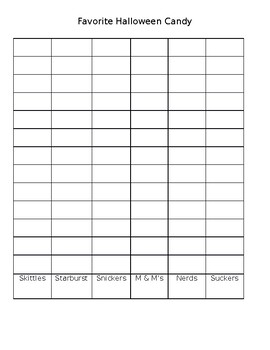
Halloween Candy Graph
This one-page blank graph can be displayed using a document camera or it can be copied for the class. This would require a vote first then the data collection can be added to the graph.
Grades:
PreK - 4th
Types:
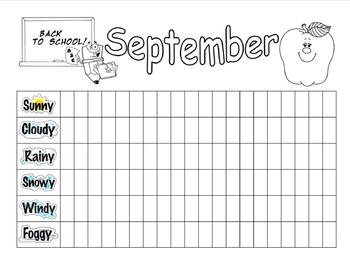
Weather Graph - September
September Weather Graph - sunny, cloudy, rainy, snowy, windy, foggy.
Publisher file can be changed to use for any month of the year.
Subjects:
Grades:
PreK - 3rd
Types:

Bar Graph/Pictograph outline
Have your students ask friends about what their favourite fruit/vegetable/anything is!
Students can choose their topic and then the three items. They will then tally the votes by doing a survey and then independently complete the graph using their collected data.
Grades:
PreK - 2nd
Types:
Showing 1-19 of 19 results


