81 results
Precalculus laboratories
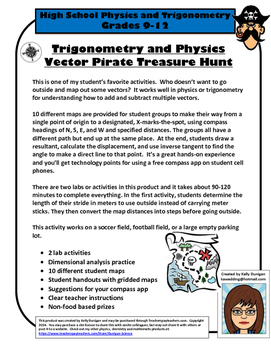
Make Multiple Vectors Fun! Pirate Treasure Hunt - Physics, Trigonometry
This is one of my student’s favorite activities. Who doesn’t want to go outside and map out some vectors? It works well in physics or trigonometry for understanding how to add and subtract multiple vectors. 10 different maps are provided for student groups to make their way from a single point of origin to a designated, X-marks-the-spot, using compass headings of N, S, E, and W and specified distances. The groups all have a different path but end up at the same place. At the end, students dr
Subjects:
Grades:
8th - 12th, Higher Education, Adult Education
Types:
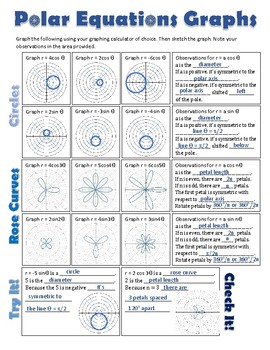
Polar Graphs Investigation
Students will investigate circles, rose curves, limaçons, and lemniscates. They will note observations based on patterns they see. Instructions for setting up various calculators (TI, Geogebra, and Desmos) are included.
Subjects:
Grades:
11th - 12th
Types:
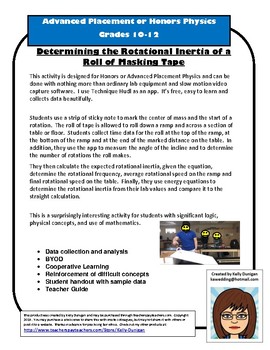
Rotational Inertia of a Roll Of Masking Tape Lab - Honors or AP Physics
Determining the Rotational Inertia of a Roll of Masking TapeThis activity is designed for Honors or Advanced Placement Physics and can be done with nothing more than ordinary lab equipment - meter sticks, a balance, and an inclined plane (I use foam core science fair boards) and slow motion video capture software. I use Technique Hudl as an app. It’s free, easy to learn and collects data beautifully but you can use any slo-motion app you'd like or even use a stop watch though your data won't be
Subjects:
Grades:
10th - 12th, Higher Education
Types:
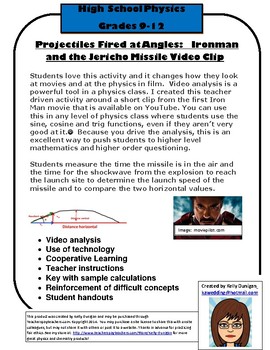
Projectile Motion Video Analysis Jericho Missile Iron Man
Students love this activity and it changes how they look at movies and at the physics in film. Video analysis is a powerful tool in a physics class and your students will look forward to the next one.
I created this teacher driven activity around a short clip from the first Iron Man movie that is available on YouTube. You can use this in any level of physics class where students use the sine, cosine and trig functions, even if they aren’t very good at it. Because you drive the analysis, thi
Subjects:
Grades:
9th - 12th, Higher Education
Types:
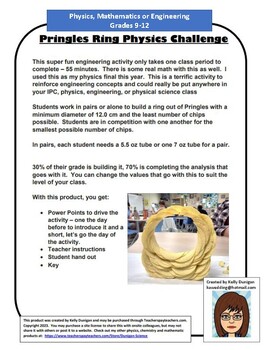
Pringles Ring Physics Challenge
This super fun engineering activity only takes one class period to complete – 55 minutes. There is some real math with this as well. I used this as my physics final this year. This is a terrific activity to reinforce engineering concepts and could really be put anywhere in your IPC, physics, engineering, or physical science class Students work in pairs or alone to build a vertical ring out of Pringles Chips/Crisps with a minimum diameter of 12.0 cm and the least number of chips possible. Student
Subjects:
Grades:
9th - 12th
Types:
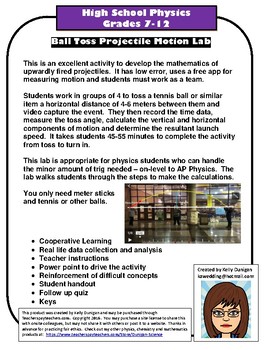
Ball Toss Projectile Motion Activity - On Level, Trig Based or AP Physics
This is an excellent activity to develop the mathematics of upwardly fired projectiles. It has low error, uses a free app for measuring motion and students must work as a team.Students work in groups of 4 to toss a tennis ball or similar item a horizontal distance of 4-6 meters between them and video capture the event. They then record the time data, measure the toss angle, calculate the vertical and horizontal components of motion and determine the resultant launch speed. It takes students 4
Subjects:
Grades:
9th - 12th
Types:
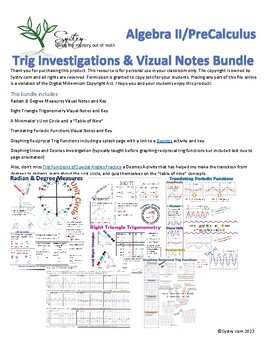
Trig Bundle
This bundle includes: Radian & Degree Measures Vizual Notes and KeyRight Triangle Trigonometry Vizual Notes and KeyA Minimalist’s Unit Circle and a “Table of Nine” Translating Periodic Functions Vizual Notes and KeyGraphing Reciprocal Trig Functions including a splash page with a link to a Desmos activity and key.Graphing Sines and Cosines Investigation (typically taught before graphing reciprocal trig functions but included last due to page orientation)Also, don’t miss Trig Functions of Sp
Subjects:
Grades:
10th - 12th, Higher Education
CCSS:
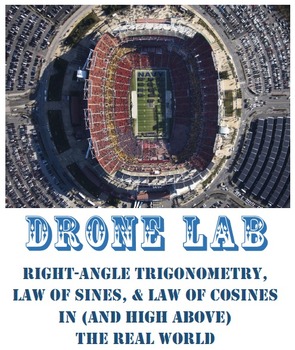
Drone Lab: Right-Angle Trigonometry, Law of Sines, Law of Cosines
YOU DO NOT NEED A DRONE FOR THIS LAB!!! This lab actually has two separate folders: one for teachers who have access to a drone (or even a helium balloon that is tied to a kite string!) and one for teachers with no drone. Any way you do it, you get a customized lab, designed to help your students use right-angle trig, law of sines, and law of cosines in real-world situations. If you are droneless, the whole simulation is set up for you. You can choose whatever drone heights you like and ente
Subjects:
Grades:
10th - 12th
Types:
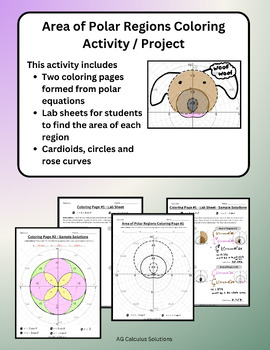
Area of Polar Regions Coloring Page Activity / Project Calculus II / BC
Help students explore area between polar curves using this coloring page activity. This activity can easily be turned into a project for students to complete on their own or an in-class activity. This activity covers AP Calculus BC Topics9.8 Find the Area of a Polar Region or the Area Bounded by a Single Polar Curve9.9 Finding the Area of the Region Bounded by Two Polar CurvesThis activity includes two interactive coloring pages and an extensive key that maps how to find the area of each region
Subjects:
Grades:
10th - 12th
Types:
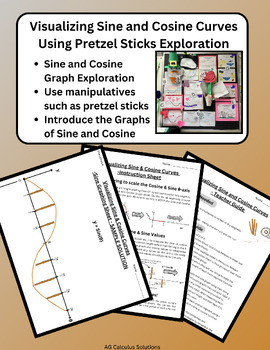
Introduction to Visualizing & Graphing Sine & Cosine Using Pretzels Exploration
Help students make connections while introducing the graphs of sine and cosine using mini pretzel sticks or equivalent manipulatives. Within this lesson, students will be able to interact with both the sine and cosine graphs using manipulatives such as string and pretzel sticks as they form a tactile graph in groups or individually. A thorough instruction sheet is provided to ensure all students are equipped to create their own pretzel graph. You can also substitute spaghetti, straws toothpicks
Subjects:
Grades:
10th - 12th
Types:
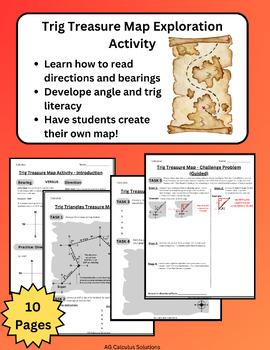
Trig Treasure Map Activity - Precalc Solving Triangles w/ Bearings & Directions
Help your students understand the concept of navigation using trigonometry. This lesson gives students adequate exposure navigational tools such as trig bearings and directions. Not only that, but it offers an excellent opportunity for enrichment through the challenge problem which is tiered into two difficulty levels - guided and unguided. Your students will love being able to make their own treasure maps while also learning key trig concepts such as finding missing side lengths using sine and
Subjects:
Grades:
10th - 12th
Types:
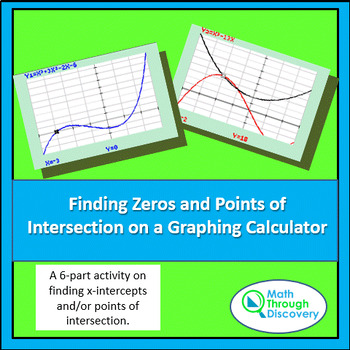
Alg 2 - Finding Zeros and Points of Intersection on a Graphing Calculator
This activity is broken into seven parts. Part I: Guides students in noticing that the trace key may not locate the x-intercepts (zeros) but shows them that there is another way x-intercepts can be found. Part II: Illustrates that there are algebraic techniques that can be incorporated in finding zeros.Part III: Shows student show to use a built-in feature to find x-intercepts or zeros.Part IV: Investigates how tables can be used to find x-intercepts and/or points of intersection. Part V: Chall
Subjects:
Grades:
10th - 12th
Types:
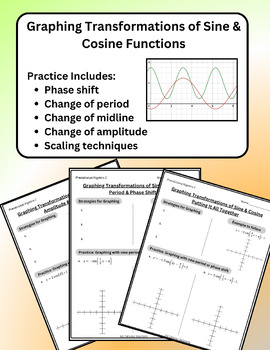
Transforming Sine & Cosine Graphs - Practice / Lesson / Worksheet
Help students learn how to graph all the transformations of the sine and cosine graphs using this interactive practice guide. The practice includes how to adjust the graph's period, amplitude, midline, phase shift and strategies for coming up with a proper scale for each tick mark on the x-axis. A comprehensive answer key is included in the packet along with some sample strategies to teach to students if needed. This lesson corresponds to AP Precalculus Sections 3-4, 3-5 and 3-6
Subjects:
Grades:
9th - 12th
Also included in: Transforming Sine, Cosine, Tangent, Secant, Cosecant, Cotangent BUNDLE
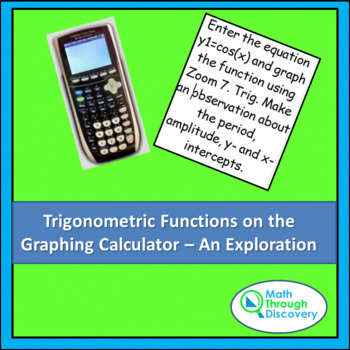
Trigonometric Functions on the Graphing Calculator - An Exploration
This activity sheet engages students in studying the general trigonometric equation y = a + b cos(cx) and making statements about the period, amplitude, y-intercept, and x-intercepts. After developing ideas with the cosine function, students make conjectures about similar sine graphs and then make a prediction of how a cosine graph would be changed to produce a particular graph.
Subjects:
Grades:
10th - 12th
Types:
Lab: Drawing a Parabola
Uses the concept that a parabola is created when points are equidistant from a focus and a directrix. Students will need a compass, and 2 different colored pencils. A calculator may be needed. I recommend running the paper off on card stock.
Subjects:
Grades:
10th - 12th
Types:
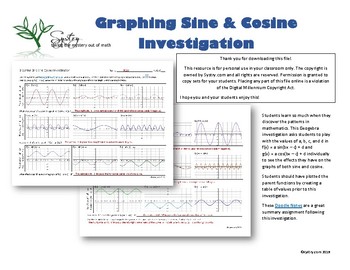
Graphing Sine & Cosine Investigation
Students learn so much when they discover the patterns in mathematics. This Geogebra investigation asks students to play with the values of a, b, c, and d in f(x) = a sin(bx – c) + d and g(x) = a cos(bx – c) + d individually to see the effects they have on the graphs of both sine and cosine.Students should have plotted the parent functions by creating a table of values prior to this investigation. These Vizual Notes are a great summary assignment following this investigation.If you are looking
Subjects:
Grades:
10th - 12th
Types:
CCSS:
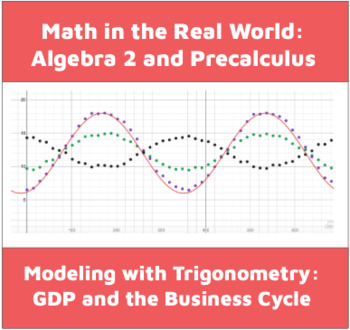
Modeling the Business Cycle with Trig Functions: Activity and Data Set
In this lab, students analyze GDP data from five fictional countries. To complete the activity, students:-- create scatterplots of their data using desmos.com/calculator (or other graphing utility)-- use their data sets to compute the parameters of underlying sinusoidal functions and use Desmos to compare their estimates to the data sets-- interpret the parameters of their equations in context by describing how the economies of each country compare and contrast to each other.-- are challenged to
Subjects:
Grades:
9th - 12th
CCSS:
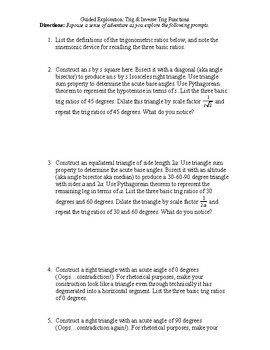
Guided Exploration: Trig & Inverse Trig Functions
35-item teacher-lead inquiry into properties and behavior of Trigonometric/Inverse Trigonometric Functions. Best used at the beginning of a unit on trigonometric/inverse trigonometric functions (before demonstrating how to solve textbook problems), this activity invites students to use inductive reasoning and class discussion to discover the big ideas behind graphing trigonometric/inverse trigonometric functions without a graphing utility.
Subjects:
Grades:
10th - 12th
Types:
CCSS:
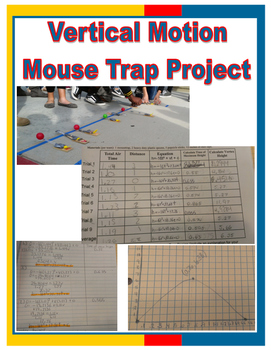
Vertical Motion Mouse Trap Project
Students will create mouse trap catapults from mouse traps, craft sticks, plastic spoons and duct tape. Students will launch ping pong balls and record initial height, time and distance for 9 trials. They will then find the average air time and average distance. Next, they will substitute in their average time (t), initial height (c), and end height (h) into the equation h=-16t² + vt + c and solve for v, for each of the 9 trials & average. Once they have their initial velocity they substitu
Subjects:
Grades:
9th - 12th
Types:

Vector Treasure Hunt
This activity is designed to teach the students about displacement vectors. There are three parts in four pages. In part II of the lab students make a hunt for other students to follow based on vectors. The next day, students go out, follow the directions and find the "treasure". Very fun activity that teaches the students the basics of vectors. Appropriate for grades 7-12 with an emphasis on beginning physics students.
Subjects:
Grades:
7th - 12th
Types:
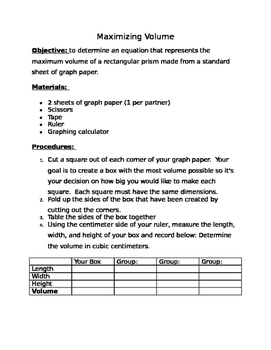
Maximizing Volume: Cubic Functions (popcorn lab)
Student will create boxes from graph paper. Their goal is to make a bog with the biggest volume possible. They will then determine an equation representing the volume of a box. They'll use a graphing calculator to determine the maximum volume and height of the box as well as the domain and range. at the end of the activity they will determine how many pieces of popcorn could fit in their box. the teacher will then give them popcorn to snack on. This activity is a HIT! especially with those
Subjects:
Grades:
10th - 12th
Types:
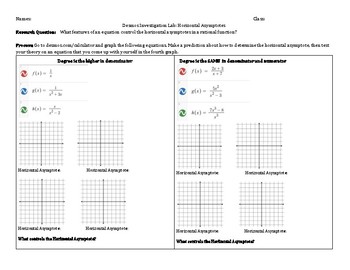
Rational Functions Asymptotes Investigation Task
Help your students discover the patterns of horizontal asymptotes in this interactive rational functions math lab!
Students explore the three "cases" for horizontal asymptotes in rational functions.Students use the desmos calculator to discover the patterns that govern horizontal asymptotes, and extend their knowledge to understand how to find slant asymptotes.
Students then practice recognizing horizontal asymptotes of rational functions by sorting them according to case ( based on the degr
Subjects:
Grades:
10th - 12th
Types:
CCSS:

Alg 1 - Modeling Exponential Growth-Decay on the Graphing Calculator
This is a graphing calculator activity that will engage the students in collecting data on both exponential growth and decay using M&Ms. The graphing calculator is used to create scatter plots and equations that represent both situations from the data collected.In part I the students, after students have collected data using the M&M’s students are guided at entering the data into their graphing calculators. Screen shots guide and assist the students in the calculator steps. When they h
Subjects:
Grades:
9th - 12th
Types:
CCSS:
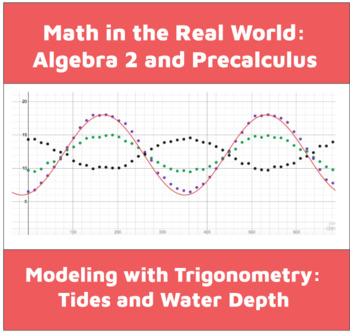
Modeling Tides with Trigonometric Functions
In this activity, students analyze data sets about water depth through the daily tidal cycle. While completing this activity, students:-- create scatterplots using desmos.com/calculator-- practice computing the parameters of sinusoidal functions and check their work by fitting an equation to the scatterplot-- interpret the meaning of different parameters in context-- determine how a verbal description of changes to the environment would impact parameter values-- introduce a new term to a basic s
Subjects:
Grades:
9th - 12th
CCSS:
Showing 1-24 of 81 results

