2,424 results
Graphing lesson pdfs
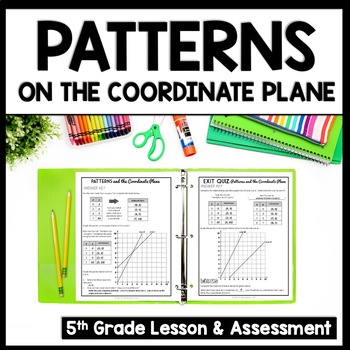
Patterns & Coordinate Grid/Plane Notes, Graphing Ordered Pairs, Plotting Points
Are your students struggling with plotting points on a coordinate grid? Try these Patterns on the Coordinate Plane Notes! After 8 pages of coordinate graphing & using ordered pairs to create lines in quadrant 1, your students will be experts! This lesson packet is perfect for small-group math intervention or whole-group review. Best of all, these Patterns on the Coordinate Plane notes require NO PREP! Just print and teach!This “Plotting Ordered Pairs to Create Patterns” packet includes: ✅
Subjects:
Grades:
5th - 6th
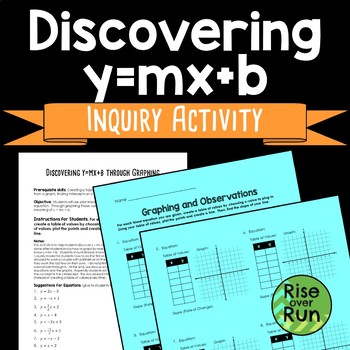
Discovering y=mx+b through Graphing, Slope Intercept Form
This activity will help students discover the slope and y-intercept of slope-intercept form. Students will use prior knowledge of creating a table of values from an equation. Through graphing those values, student will observe and discover the meaning of y = mx + b, slope-intercept form. This activity is to help students discover y = mx + b without being told its meaning. It should be done after students know how to graph by making a table of values, but before students know y = mx + b. Stude
Grades:
7th - 8th
Types:
CCSS:
Also included in: 8th Grade Math Discovery Lessons and Activities Bundle
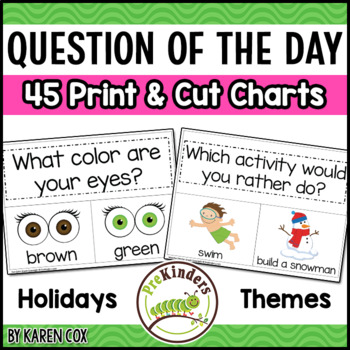
Question of the Day Graph Kit for Preschool, Pre-K, K
Print and cut these 45 graphs for simple and quick large group activities!Includes holidays and themes. Whole group Math and Literacy.You can laminate and reuse these each year in a pocket chart, or print and glue to chart paper.-----------------------------------------------------------------------------------------------------------------Want more Graph Kits? Click here to see all Graph Sets!-------------------------------------------------------------------------------------------------------
Subjects:
Grades:
PreK - K
Types:
CCSS:
Also included in: Question of the Day Graphs Preschool Pre-K Kindergarten BUNDLE
Grade 3, Unit 3: Data Literacy (Ontario Math)
Grade 3, Unit 3: Data Literacy is a 150+ paged resource designed to meet the Ontario 2020 Mathematics curriculum expectations for the Data strand. This resource includes lessons, activities, and assessments that introduce students to bar graphs, pictographs, frequency tables, and sorting using three attributes. Please note this is a printable resource. There is NO Google Slide component to this resource.Wonderland Math is a math unit series designed to meet the Ontario 2020 Mathematics curriculu
Subjects:
Grades:
3rd
Types:
Grade 2, Unit 3: Data Literacy (Ontario Mathematics)
The Grade 2, Unit 3: Data Literacy resource is a 100+-paged resource designed to meet the 2020 Ontario Mathematics curriculum expectations for Strand D: Data. This unit introduces students to concrete graphs, pictographs, and tally charts. Students learn how to read and interpret graphs and draw conclusions based on pre-made graphs. Students also create simple surveys involving 2 - 4 options, conduct the survey, and collect and interpret data. Please note this is a printable resource. There is N
Subjects:
Grades:
2nd
Types:
Also included in: Grade 2 Wonderland Mathematics: The Bundle (Ontario 2020 Math)
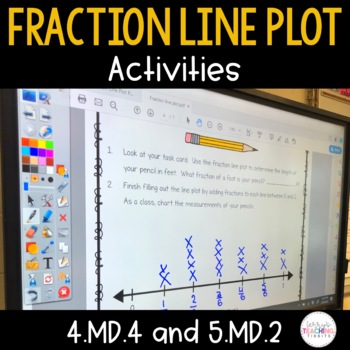
Fraction Line Plot Activities - 4.MD.4 and 5.MD.2
Plotting fractions on a number line has never looked so fun! This pack comes with 3 whole group or small group activities for fraction line plots. Students are given individual task cards of an object measured on a fraction number line. As a class, each student will determine the fraction of their object and plot it onto a class line plot. Students will then use their class-created data and answer to answer questions.What You Get:3 sets of task cards (pencils, nails, and erasers)28 task card
Subjects:
Grades:
4th - 6th
Types:
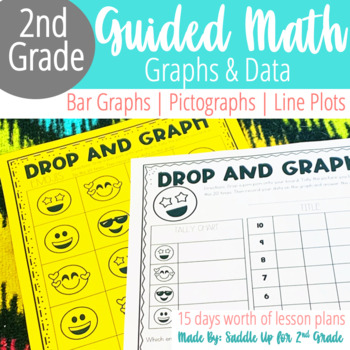
2nd Grade Graphing & Types of Graphs: Bar Graphs, Pictographs, & Line Plots
Do you need engaging 2nd grade guided math lessons and resources? This pack of 2nd grade graphing lesson plans is filled with hands-on engagement and interactive notebook activities! These PRINT & GO lesson plans will help you teach various types of graphs such as bar graphs, pictographs, and line plots. This 2nd grade guided math unit comes with 3 weeks worth of done-for-you lesson plans to teach types of graphs and data. These 2nd grade graphing activities were created to introduce, practi
Grades:
2nd
Types:
Grade 1, Unit 4: Data Literacy (Ontario Mathematics)
The Grade 1, Unit 4: Data Literacy resource is a 100+-paged resource designed to meet the 2020 Ontario Mathematics curriculum expectations for Strand D: Data. This unit introduces students to concrete graphs, pictographs, and tally charts. Students learn how to read and interpret graphs and draw conclusions based on pre-made graphs. Students also create simple surveys involving 2 - 4 options, conduct the survey, and collect and interpret data. Please note this is a printable resource. There is N
Subjects:
Grades:
Homeschool
Types:
Also included in: Grade 1 Wonderland Mathematics: The Bundle (Ontario Mathematics)
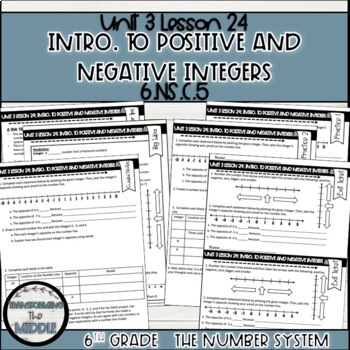
Positive and Negative Integers on the Number Line Lesson | 6th Grade Math
This Introduction to Positive and Negative Integers lesson is a full aligned lesson for 6th grade Math Common Core standard 6.NS.C.5. This lesson introduces students to negative integers on the number line and provides practice for students to find opposite values of integers.About This Product:-PDF printable-13 page printable lesson includes:1 teacher overview/product page1 lesson notes page that explains the standards and flow of the lesson1 teacher tips page that explains key points and ideas
Grade 4, Unit 3: Data Literacy (Ontario Mathematics)
Grade 4, Unit 3: Data Literacy is a 100+ paged resource designed to meet the Ontario 2020 Mathematics curriculum expectations for the Data strand. This resource includes lessons, activities, and assessments that introduce students to multiple bar graphs, stem-and-leaf plots, frequency tables, and infographics. Please note this is a printable resource. There is NO Google Slide component to this resource.Wonderland Math is a math unit series designed to meet the Ontario 2020 Mathematics curriculum
Subjects:
Grades:
4th
Types:
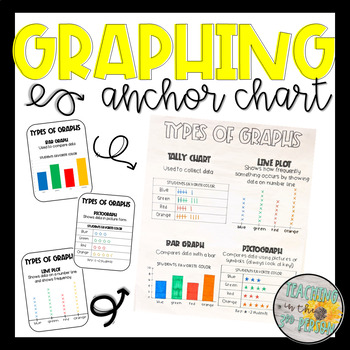
Types of Graphs Anchor Chart - Tally Chart, Bar Graph, Pictograph, Line Plot
Graphing made easy!Use these templates as a guide in creating your own anchor charts or print and use them in other helpful ways:Trace and create an anchor chart with studentsPrint on bright colored paper and use as postersShrink down and glue in student' math notebooks for a reference sheetPrint and send home as reference tools for students and parents (homework or tutoring)Earn Credit for Future Purchases:I appreciate each & every word of your valuable feedback. Also, if you leave feedback
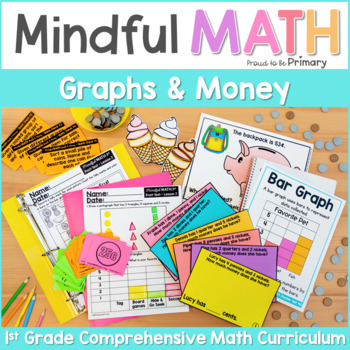
Grade 1 Math - Graphing, Money & Financial Literacy - First Grade Math Centers
This Mindful Math First Grade Money and Graphing unit is a comprehensive math curriculum that was designed to be teacher and student-friendly and includes 9 lessons to teach money (coins, counting coins, and financial literacy) and graphing (collect, organize, display and describe data on pictographs and bar graphs).It was created to give teachers a ready-to-teach math curriculum that is fun, engages minds, and leaves students knowledgeable and fluent in math concepts.Go from boring, complicated
Subjects:
Grades:
1st
Types:
CCSS:
Back to School MEGA Pack! {Grades 1-3}
This 89 page pack is FULL of engaging activities, printables and craftivities that are perfect to use those first couple of weeks with your new students! Activities are geared for grades 1-3. **DOWNLOAD THE PREVIEW FOR A PEAK AT MOST PAGES!**
There are activities to go along with the following books:
-Chrysanthemum
-Have You Filled a Bucket Today?
-Wemberly Worried
-I Like Myself!
-The Crayon Box That Talked
-A Bad Case of Tattle Tongue
Table of Contents:
Pg. 3: List of books needed
Pg.
Grades:
1st - 3rd
Types:
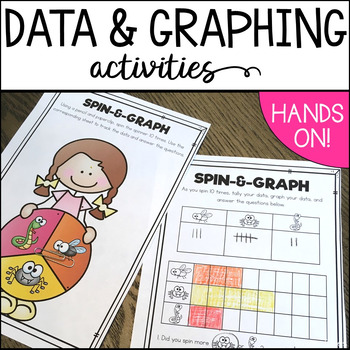
Data and Graphing Activities for First Grade
These data and graphing lessons, activities and printables have students using fun, hands on methods to analyze, collect and record data!GET THESE ACTIVITIES AND MORE BY PURCHASING MY MATH WORKSHOP BUNDLE FOR THE WHOLE YEAR! SEE MORE HERE!The objectives of these lessons, activities, and printables are:Students will be able to:- Collect data accurately.- Organize data using different types of graphs.- Compare and analyze data shown on different graphs.In this unit:Block graphs - hands on lesson a
Subjects:
Grades:
K - 2nd
Types:
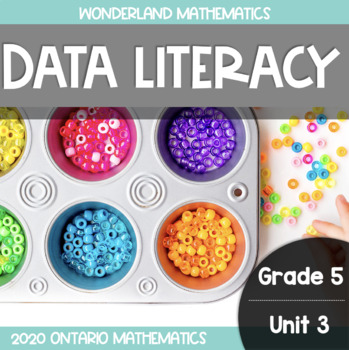
Grade 5, Unit 3: Data Literacy (Ontario Mathematics)
The Grade 5, Unit 3: Data Literacy is a 100+-paged resource designed to meet the specific expectations outlined in the 2020 Ontario Mathematics curriculum. This resource continues student understanding of what data is and how data is collected by introducing students to sampling techniques and the difference between quantitative and qualitative data. Students review what they have learned about bar graphs, multiple-bar graphs, stem-and-leaf plots, and are also introduced to stacked-bar graphs an
Subjects:
Grades:
5th
Types:
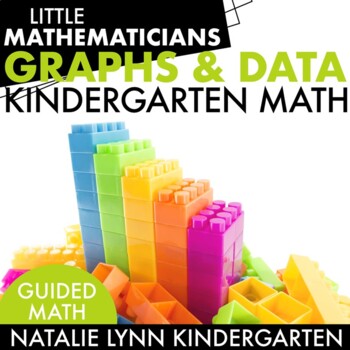
Kindergarten Graphing Math Unit | Graphs and Data Guided Math
Are you ready to explore graphing and data in Kindergarten? Everything you need to teach an engaging Kindergarten graphs and data guided math unit is included here! Students will get a better understanding of sorting by attributes, classifying, the graphing process, and types of graphs.This Kindergarten graphing unit was developed to provide hands-on graphs and data guided math lessons that can be taught either whole group or in small guided math groups.This unit just received a huge update! If
Grades:
K
Types:
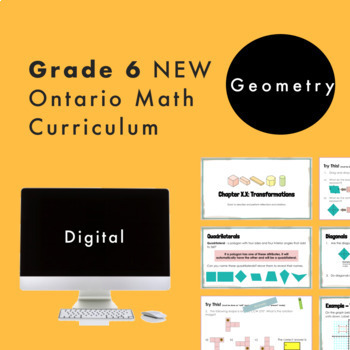
Grade 6 Ontario Math - Geometry Curriculum - Digital Google Slides+Form
Are you planning for the NEW Grade 6 Ontario Math Curriculum? This fully editable Google Slide resource is what you need! *Note that this contains NEW lessons with added expectations from the new curriculum. This resource is for the SPATIAL SENSE strand and covers ALL specific expectations for “E1. Geometric and Spatial Reasoning”. In this resource, students will experience math through engaging real-life questions, storytelling through math, and interactive slides. For teachers who are given N
Grades:
5th - 7th
Types:
Also included in: Grade 6 NEW Ontario Math Curriculum Full Year Digital Slides Bundle
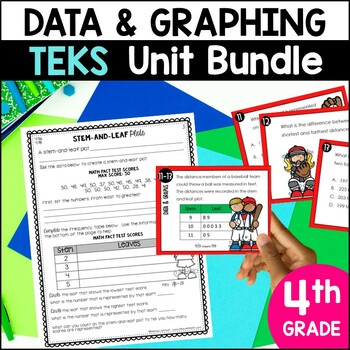
4th Grade Data and Graphing Unit - Stem and Leaf Plots, Data Analysis TEKS
Everything you need for a TEKS centered 4th grade data and graphing unit! Your students will enjoy practicing data analysis, multistep word problems, stem and leaf plots, dot plots, and frequency tables. All of the worksheets, printables, games, and task cards are designed with STAAR testing in mind. ⭐️ BUNDLE & SAVE ⭐️This TEKS graphing and data resource is also a part of the 4th Grade Year-Long Curriculum. Check it out and get everything you need to teach 4th grade math this year! This c
Subjects:
Grades:
4th
Types:
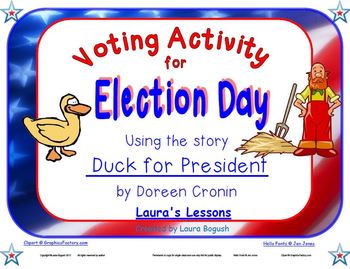
Voting Activity for Election Day Lesson using story Duck for President
A mock election is a great way to help young children understand the process of how we elect our leaders. This voting activity is the perfect lesson for use around Election Day for grades kindergarten, first, or second. Show an online video (link included in lesson) or read the book Duck for President by Doreen Cronen. A ballot is included for students to vote for who should be in charge of the farm: Duck or Farmer Brown. After ballots are collected, students work together to complete the
Subjects:
Grades:
K - 2nd
Types:
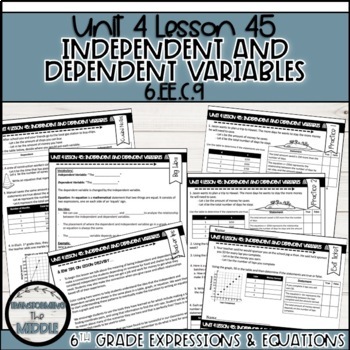
Independent and Dependent Variables Lesson | 6th Grade Math
This Independent and Dependent Variables lesson is a fully aligned lesson for 6th grade Math Common Core standards 6.EE.C.9. In this lesson, students will make a connection between independent and dependent variable and their work with tables, equations, and graphs. We will explore how to write equations based off the relationship between the variables and decipher what the relationship mean.About This Product:-PDF printable-13 page printable lesson includes:1 teacher overview/product page1 less
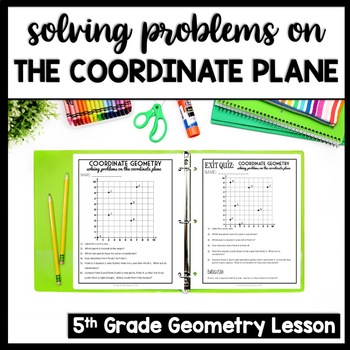
Distance on the Coordinate Plane Notes, Quadrant 1 Grid, Plotting Ordered Pairs
Are your students having trouble plotting ordered pairs on a coordinate grid? Then these Problem Solving in Quadrant 1 Coordinate Plane Notes are for you! 8-pages of graphing 2D shapes, distance on the coordinate plane, and other word problems. Perfect for small group math intervention or whole group review! Best of all, these coordinate plane notes require NO PREP! Just print and teach!This “Plotting Ordered Pairs to Solve Real-Word Problems” packet includes: ✅ Scripted Instructional Guide✅ T
Subjects:
Grades:
5th - 6th
CCSS:
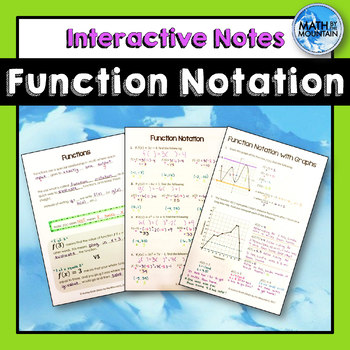
Function Notation Interactive Notebook Notes
Help your students learn how to read, interpret, and evaluate function notation from equations, graphs, and tables. These notes offer a great blend of representations and different levels of rigor to meet the needs of all of the learners in your classroom. THREE resources are included:A reference half-sheet that discusses the difference in function notation meanings to clear up common misconceptions. A mini-book set of notes that covers algabraic representations of function notation. A mini-book
Subjects:
Grades:
8th - 11th
CCSS:
Also included in: Functions, Relations, and Domain and Range BUNDLE
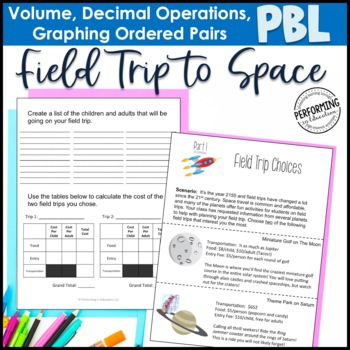
Project Based Learning: Field Trip to Space - Decimals, Graphing, Volume 5th
Project-based learning (PBL), Help your students practice decimals, measurement, volume, and graphing ordered pairs with this quality project-based learning for 5th grade. It includes a teacher guide walking you through each step.Have you ever wondered what field trips will be like in the future? During this activity, kids get to choose from some wonderful field trips to space. They then calculate the cost of the trips and compare them using graphs. The data they choose will help them make a fin
Subjects:
Grades:
5th
Types:
Also included in: 5th Project Based Learning Math Starter Kit Bundle
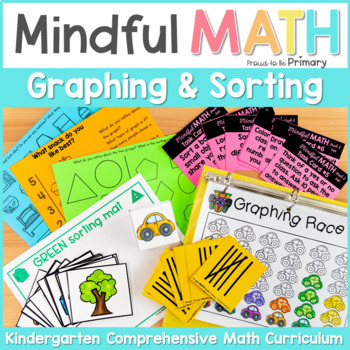
Kindergarten Math - Graphing & Sorting Unit - Math Centers, Lessons & Activities
This Mindful Math Kindergarten Graphing and Sorting unit is a comprehensive math curriculum that was designed to be teacher and student-friendly and includes 9 lessons to teach graphing (tally graphs, pictographs, and bar graphs), sorting (alike and different, sorting by one and two attributes - color, shape, size), and probability (impossible and possible; always, sometimes, never). It was created to give teachers a ready-to-teach math curriculum that is fun, engages minds, and leaves students
Subjects:
Grades:
K
Types:
CCSS:
Showing 1-24 of 2,424 results


