43 results
Graphing lessons for Easel
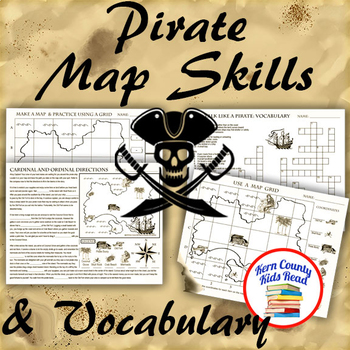
Pirate Map Skills: Grid Coordinates, Cardinal & Ordinal Directions, Symbols
Teach and strengthen coordinate grid math, geography mapping skills like map symbols and cardinal and ordinal directions with a compass rose, and new vocabulary with these pirate themed printable worksheets. These are fun mini-lesson activities for Talk Like A Pirate Day on September 19th or if you have a pirates themed unit. Cardinal directions and coordinate grid mapping are important introductory skills to mastering latitude and longitude map skills and being able to use an atlas. Coordinate
Subjects:
Grades:
3rd - 6th
Also included in: Pirates Thematic Unit Study Bundle: Talk Like A Pirate Pack!
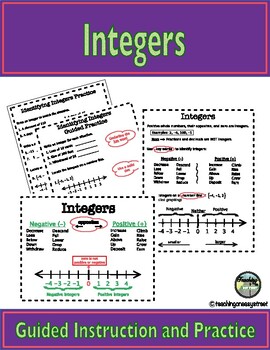
Introduction to Integers 6th Grade Math Distance Learning
Unsure if you will be in class or online? This resource gives you flexibility for either situation. Student notes, practice problems and a video lesson to accommodate distance learning or in class instruction. This lesson covers graphing integers on a number line and using key words to identify positive and negative integers. Great for interactive notebooks as well (just copy at 85%).A link to the video lesson is below:https://youtu.be/03whZ4rL3xkThis product includes:-Anchor Chart - Display in
Grades:
5th - 7th
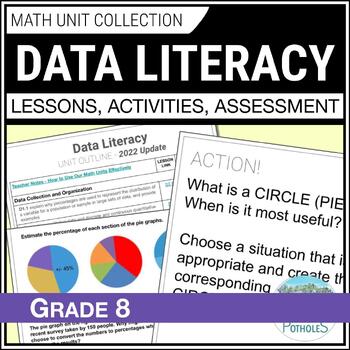
Grade 8 Ontario Data Management Unit Collecting Data Reading & Analyzing Graphs
Save time and reduce stress!! This UPDATED Data Literacy unit has EVERYTHING YOU NEED. It includes 3-part math Google Slides lessons, projectable slides for following along, taking notes, and creating anchor charts. It also includes practice worksheets, review activities, math centres, assessments, and Ontario math report card comments. Lesson Topics: Collecting and Organizing DataD1.1 - one and two-variable dataD1.2 - collect continuous dataBonus - Primary and Secondary DataBonus - Census and
Subjects:
Grades:
7th - 9th
Types:
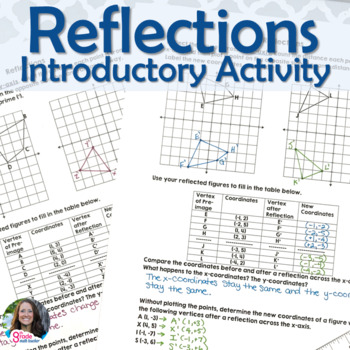
Geometric Reflections Introductory Activity for Rigid Transformations Unit
Introduce reflections to your students with this inquiry activity! Students will follow simple instructions to reflect 4 different figures across the x-axis or y-axis. They will discover how reflections affect the coordinates of the pre-image.Students record the coordinates of the reflected image in a table to organize their points. They are then asked to notice the effects of the coordinates when the figure is reflected across a particular axis. They will need to describe the effect of reflecti
Grades:
8th
Types:
Also included in: Rigid Transformations Introductory Discovery Activity BUNDLE
Producers and Consumers
These Producer and Consumer activities were designed as a cross-curricular social studies unit (Reading, Social Studies, and Math) Activities on producers, consumers, goods, and services are included in these print and go activities.
This product is part of my Economics Bundle. Click on the link below to check out the bundle and save money!
Economics Bundled Unit!
What’s Included?
1. Word Wall Posters: (Consumer, Producer, Goods, & Services)
2. We are Producers Mini Book (One in colo
Subjects:
Grades:
K - 2nd
Types:
Second Grade Common Core Math -Measurement and Data 2.MD.9-10
This 50 page unit is designed for 10 days of instruction. This unit is aligned with Common Core Math Standards 2.MD.9 and 10. Just copy the student book, staple, grab your lesson plans and you are ready to go! Included in this unit are:
Student Book Cover
Pages for a student book
Classwork for each day
Homework for each day
Unit test
Lesson Plans for 10 Days
Teaching these two standards couldn't be made easier for you. If you like this unit, check out the 3 Geometry Units in my TPT Store which
Subjects:
Grades:
2nd
Types:
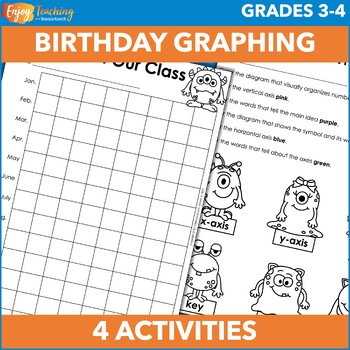
Birthday Pictograph, Bar Graph, Frequency Table & Line Plot Activities
Make graphing fun with birthdays! Together, kids create human and picture graphs. Then each child makes a bar chart. As a bonus, they can also crunch the data in frequency tables and display it on a line plot. Open the preview to take a closer look at the math activities.First, create a human graph. Ask kids to line up against a wall according to birth month. There’s only one catch: no talking! When you’re done, with a bird’s eye view, you’ve created a graph!Second, work together to build a pict
Subjects:
Grades:
3rd - 4th
Interpreting Graphs for the Middle & Junior High School: Book 2
Here is another set of data graphics for your students to analyze and interpret. Using survey results from the USA Today newspaper, students will be asked to explain what the graphics are illustrating. Each activity will ask the student to identify basic information presented in each graphic and make some projections based on the data given in the survey.
The activities in this packet are a great way to improve your student’s skills in taking apart graphic displays of information. Brin
Subjects:
Grades:
4th - 10th, Adult Education
Types:
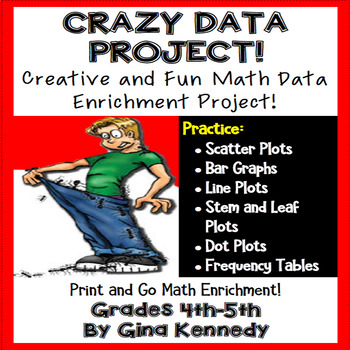
Data Project, Crazy Data Math Enrichment Project!
Data And Graphs Enrichment Project For Upper Elementary! With this project, your students will love making up their own data based on a chosen topic from a provided list. Once they've chosen their topic from such funny themes such as "ants in the pants', they will begin creating their data graphs based on the step-by-step directions included with this project. The students will then begin creating questions for other students to answer based on the data presented in their graphs. A fun way ha
Subjects:
Grades:
4th - 5th
Types:
Also included in: Math Projects "BUNDLE"! Print and Go Math Enrichment All Year!
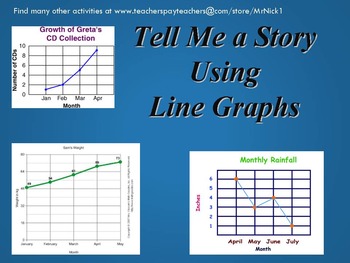
Tell me a Story using Line Graphs
Teach your students how to write across the curriculum. Want to know what your students are thinking? Here is a set of activities that will do just that. Hand out the graphic picture and the worksheet to each student or as a group assignment and ask them to complete the task. The observer or person looking at the graph is asked to tell a story presented in the graph. This packet gives each student the opportunity to “describe or tell the story” they see. You may then ask them to present th
Subjects:
Grades:
5th - 12th, Adult Education
Types:
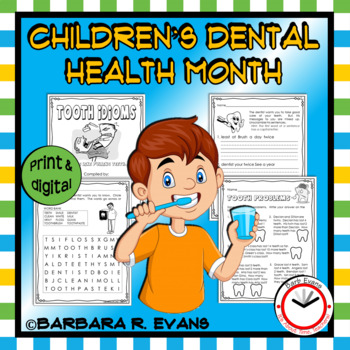
DENTAL HEALTH MONTH ACTIVITIES Freebie ELA Math
Use this freebie for Dental Health Month. Provided are teaching suggestions that include ELA and math. The materials are best suited to primary classes. This resource is print and go, as well as digitally accessible on TPT Easel.CONTENTSLost Tooth songLost Tooth graphLost Tooth bag directionsVocabulary word findScrambled sentencesTooth Idioms bookletTooth Problems mathDigital versionHOW TO USE THIS PRODUCTThe Lost Tooth graph, Lost Tooth bags, Lost Tooth song, and book links are best conducted
Subjects:
Grades:
K - 2nd
Types:
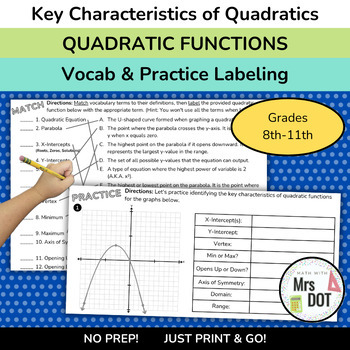
QUADRATIC FUNCTIONS: Vocab & Practice | Key Characteristics of Quadratics
Master quadratic functions with our 'Quadratic Functions: Vocab & Practice' activity. Designed for hands-on learning, it focuses on essential vocabulary and graph interpretation of quadratic equations, enhancing students' grasp of this crucial math concept.Key Features:Independent Learning: The activity is structured to encourage independent learning. Students can work through the worksheet at their own pace, reinforcing their understanding of key terms, graph labeling, and identification of
Subjects:
Grades:
8th - 11th
Types:
CCSS:
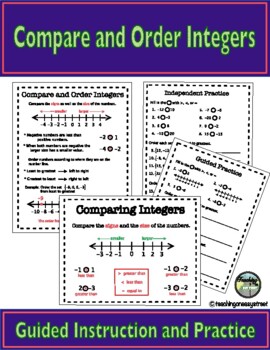
Compare and Order Integers 6th Grade Math Distance Learning
Unsure if you will be in class or online? This resource gives you flexibility for either situation. Student notes, practice problems and a video lesson to accommodate distance learning or in class instruction. This lesson covers comparing and ordering integers using a number line. Great for interactive notebooks as well (just copy at 85%).A link to the video lesson is below:https://www.youtube.com/watch?v=hixsOwPl6sMProduct includes:-Anchor Chart - Display in class or post on your online learni
Grades:
5th - 7th
CCSS:
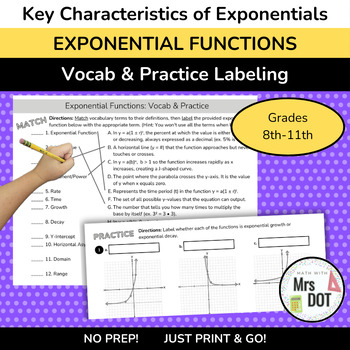
EXPONENTIAL FUNCTIONS: Vocab & Practice | Key Characteristics of Exponential
Dive into the world of exponential functions with our engaging 'Exponential Functions: Exploration & Practice' activity. Tailored for active learning, this resource delves into the critical vocabulary and graph analysis of exponential equations, enriching students' understanding of this vital mathematical concept.Key Features:Independent Learning: The activity is structured to encourage independent learning. Students can work through the worksheet at their own pace, reinforcing their underst
Subjects:
Grades:
8th - 11th
Types:
CCSS:
Slope - Understanding & Calculating-Distance Learning Print & Digital Options
This 18-page lesson covers:• Defining slope• Describing slope as positive, negative, zero, and undefined• Finding the slope given a graph using rise over run• Drawing lines given two points• Drawing lines given a point and the slope• Calculating slope given two points• Finding the slope of the sides of polygons graphed on the coordinate planeEach section includes detailed notes, guided instruction and practice, and independent practice worksheets. The Slope with Polygons worksheet can be use
Subjects:
Grades:
7th - 9th
Types:
First Grade Math-Measurement and Graphs 1.MD 1, 2 and 4
This unit teaches Common Core Measurement Standards 1.MD.1, 2 and 4.This 9 lesson unit has lesson plans, a student booklet, a test, homework practice pages, cut and glue activities, a Scavenger Hunt Story Activity, a SCOOT game and a Yummy Tasting Activity. Product Elements1.MD.1- Order three objects by length; compare the lengths of two objects indirectly by using a third object.Lesson 1 - Students will identify the longest object in a group of 3 a
Subjects:
Grades:
K - 1st
Types:
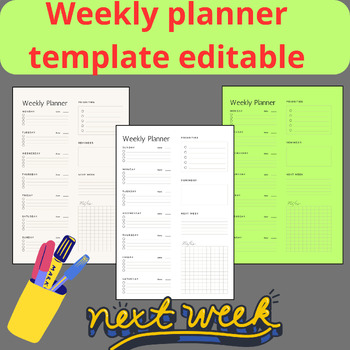
Weekly planner template editable _ Editable daily weekly teacher planner digital
The weekly planner template is a useful tool for organizing and managing tasks, appointments, and activities throughout the week. This editable weekly planner template provides the flexibility to customize and adapt the design to suit your specific needs and preferences. Here is a description of a typical editable weekly planner template: 1. Layout: The template usually features a clean and organized layout with the days of the week arranged horizontally from Monday to Sunday. 2. Editable Fi
Subjects:
Grades:
Not Grade Specific
Types:
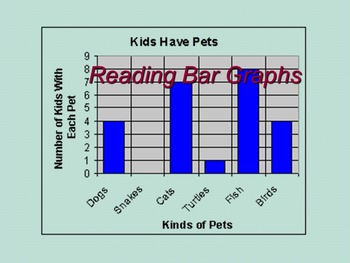
Reading a Bar Graph: meeting the Common Core.
Here is an activity to challenge your students into a higher thinking level from the traditional basics. “Reading a Bar Graph” will introduce your student into interpreting graphs using a step by step guide. “Reading a Bar Graph” will present the teacher with an option of introducing their students to interpret these graphs by applying a step by step a power point format or PDF format.
Use the step by step power point guide on a smart board, overhead projection system, or board & wo
Subjects:
Grades:
2nd - 12th, Adult Education
Types:
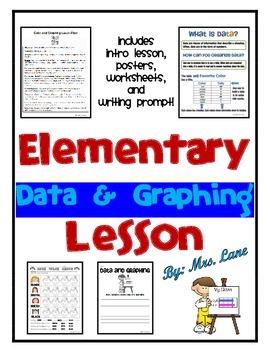
Elementary Data and Graphing Lesson
Are you looking for a basic data and graphing intro lesson? Look no further! Save your valuable time because you found it!
------------------------------------------------------------------------------------------------
*THIS PRODUCT INCLUDES:
-Intro Lesson (1)
-Posters (3) : What is data? How can you organize data?, How can a graph be used to represent data? Pictograph, Bar Graph, Circle or Pie Graph, and Line Graph
-Worksheets (3) Hair Color Graph, Eye Color Graph, and Help me make a gr
Subjects:
Grades:
2nd - 4th
Types:
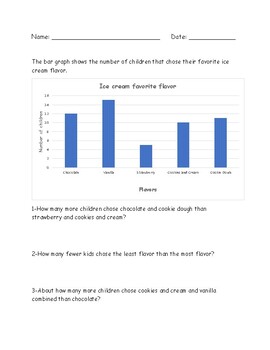
Bar Graph 2 and 3 Steps Questions How Many More or How Many Fewer Graphing Data
This product has been created to help students to think and solve 2 and 3 steps problems after they analyze the data using key words like more than and fewer than. It is totally editable.This resource was created to support 3rd grade Common Core standard 3.MD.3: Draw a scaled picture graph and a scaled bar graph to represent a data set with several categories. Solve one- and two-step "how many more" and "how many less" problems using information presented in scaled bar graphs.This resource can b
Grades:
3rd - 4th
Types:
CCSS:
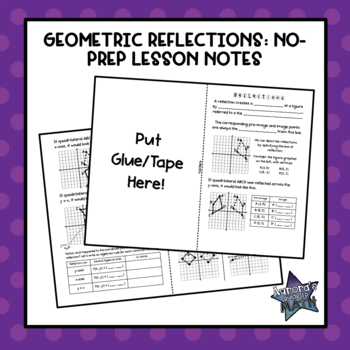
Geometric Reflections: No-Prep Notes
Geometric Translations: No-Prep NotesThis no-prep resource is a great way to introduce students to reflections for the first time! Included is a three-panel printable of scaffolded notes and examples, perfect for a guided lesson on geometric reflections, as well as a teacher guide and set of completed notes. The student printable is formatted with the intended use in an interactive composition toolkit/notebook, where the page is folded in half and glued in to the notebook, however it can be easi
Grades:
6th - 12th
Creating Graphs from Data:Meeting the Common Core
Creating a graph to represent data gives us a better picture of what the numbers are trying to tell us. Using a step-by-step approach, this activity will demonstrate for each student how to generate various types of graphs and plots to interpret given data. Terms such as range, class, frequency, interval, pie charts, histograms, and line graphs are introduced to assist the student in creating and understanding these graphs. After introducing the terms and a class discussion has taken place,
Subjects:
Grades:
4th - 12th, Higher Education, Adult Education
Types:
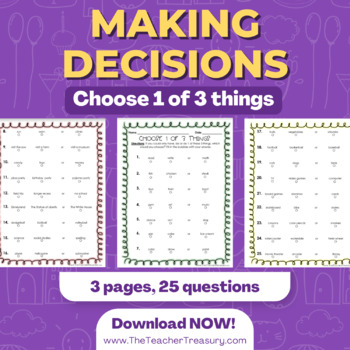
Making Decisions - Choose 1 of 3 Things
3 pages, 25 questions.Directions: If you could only have, be or do 1 of these 3 things, which would you choose? Fill in the bubbles with your answer.This is a fun activity to do whenever. It'll teach you a little about your students and you can take a survey of your own to share your answers with them!After students complete the pages, ask each question aloud and have them raise their hands when you select their option. This is a great way to introduce tally marks, voting and/or graphing results
Subjects:
Grades:
2nd - 5th
Also included in: Back To School Activities Pack - Fun ELA Resources
Interpreting Graphs: Meeting the Common Core: Booklet 3
Want to improve your student’s skills in interpreting graphs. Here is a wonderful set of activities to help your students better analyze graphs. Meet the required Common Core standards with this product. This packet contains 5 activities plus a more advanced graphic to be analyzed. An answer guide is provided to better assist you with each activity. Common core standards include 6.SP.B.4.
Some additional activities you may wish to check out: (Just click on the link provided)
Title: Task C
Subjects:
Grades:
4th - 8th, Adult Education
Types:
CCSS:
Showing 1-24 of 43 results


