13 results
Applied math lessons for Microsoft Excel
Statistics Unit 9 Bundle - Hypothesis Testing (one sample) (18 days)
This is a unit plan bundle for a Statistics class. The plans include common core math standards, time frame, activities, enduring understandings, essential questions, and resources used. It is designed to last 18 days, depending on pacing. The plans include: 56-slide presentation, with annotated guide for reference5 Worksheets1 "Read & Respond" Article Worksheet2 Quizzes"Do Now" Entrance problemsSpreadsheet Activity - Hypothesis TestingReview slides (for peer presentations)Unit ReviewUnit Te
Subjects:
Grades:
10th - 12th, Higher Education
Types:
CCSS:
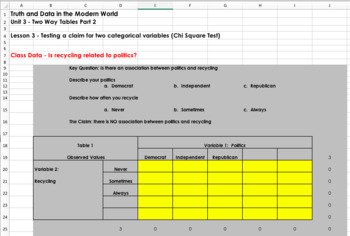
Teaching Statistics with Spreadsheets (Self Grading)
You can see a video that describes the basics of this course at the following link: https://www.youtube.com/watch?v=uZFpltXWyw8This package is an entire statistics course designed for content to be delivered, taught, practiced, and assessed through spreadsheets. Students learn basic statistics and spreadsheet skills. This course is intended to allow for student collaboration and group work throughout the learning process. Each spreadsheet is automatically graded so students can see their progres
Grades:
9th - 12th
Types:
Statistics Unit 8 Bundle - Confidence Intervals (19 days)
This is a unit plan bundle for a Statistics class. The plans include common core math standards, time frame, activities, enduring understandings, essential questions, and resources used. It is designed to last 19 days, depending on pacing. The plans include: 52-slide presentation, with annotated guide for reference5 Worksheets3 Quizzes"Do Now" Entrance problemsSpreadsheet Activity - T-DistributionReview slides (for review response system)Unit test (with review packet)Unit Project - Gather Data,
Subjects:
Grades:
10th - 12th, Higher Education
Types:
CCSS:
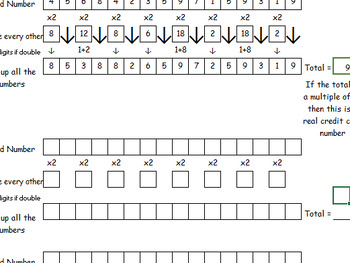
Creating real working credit card numbers using Luhn's algorithm
Great easy to follow worksheet that will keep any student engaged!Using Luhn’s algorithm you can visually see how to apply this to check the validity of credit card numbers. I set up the table so that students can input a 16 digit number and follow the simple process to check if their number works.I start with a worked example and then I have two sides of blanks for students to use. This is a great lesson for Xmas, Easter or Summer break last lesson if you are looking for a lesson that will make
Subjects:
Grades:
8th - 11th
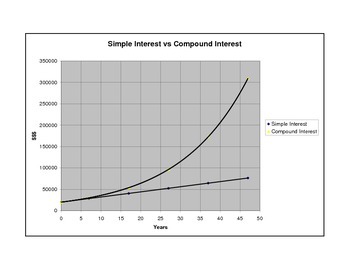
Explore Simple Interest v Compound Interest - Real World Math Exponential Growth
This activity will help students explore the power of exponential growth as they compare simple interest vs. compound interest.
This activity has three components.
The first component will have students calculate interest earned and new balance using simple interest over the course of four years. It then has students calculate the new balance, year by year, if using compound interest.
The second component introduces the compound interest formula (students will love not having to calculat
Subjects:
Grades:
6th - 9th
Types:
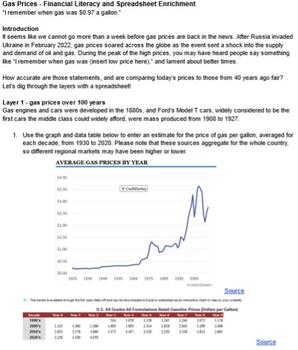
Financial Literacy - 100 years of Gas Prices
This original enrichment lesson (60-70 minutes) walks students through a deep dive of gas prices and transportation costs from the 1920s to the 2020s. It asks students to size down large data sets into decade-sized chunks using approximation skills and use basic equations in a Google Sheet to compare the cost numbers across three layers of depth: inflation, fuel efficiency, and driving habits.The folder contains1. Google Doc student worksheet (4 pg) with links to data and inflation calculators.2
Subjects:
Grades:
9th - 12th
Reading Between the Lines - A Graphing Activity
This graphing activity is a fun way to combine Reading and Math. Using excerpts from school novels, students can create frequency tables and a variety of graphs either by hand or on the computer. This 1-2 class activity can be adapted for any grade level and can be done in small groups or individually. It can also be worked on over a period of time. Give it a try!
Subjects:
Grades:
6th - 7th
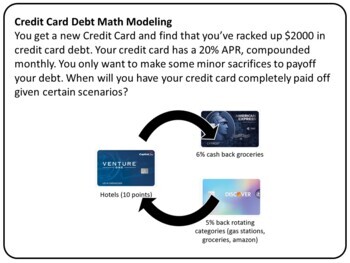
Credit Card Math Modeling
Any kind of financial problem is a great application for students and a valuable life lesson. This group exercise is designed to pique students’ interests in credit cards; how they can learn to use it to their advantage when they eventually get one without falling into an endless cycle of debt. This activity is always very well received with a few students always sticking around after class wanting to discuss more. In the included solution sheet, we show how to gently introduce a math modeling a
Subjects:
Grades:
9th - 12th, Higher Education, Adult Education
Types:
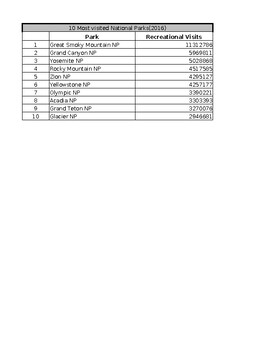
Guided Notes Data Supplement - Lesson 1.2 - National Parks Data
IB Applications & Interpretations SL: Supplemental data for Lesson 1.2 - National Parks
Subjects:
Grades:
10th - 12th
Types:
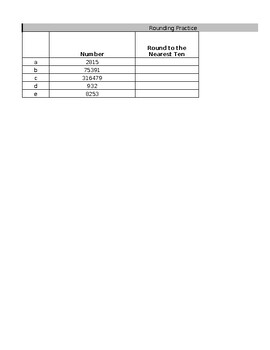
Guided Notes Data Supplement - Lesson 1.2 - Rounding Practice
IB Applications & Interpretations SL: Supplemental data for Lesson 1.2 - Rounding Practice
Subjects:
Grades:
10th - 12th
Types:
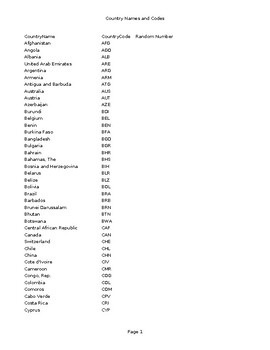
Guided Notes Data Supplement - Lesson 3.4
IB Applications & Interpretations:
Subjects:
Grades:
10th - 12th
Types:

Basic Excel spreadsheet lesson plan. Suitable for grades 5-9.
Using this spreadsheet sesson, students will create a record of earning form their part time job. They will compute gross pay, make deductions, and compute net pay for a five week period. They will learn to format cells to accept numbers, decimals, and text. In the complete file, there are directions and samples.
Subjects:
Grades:
5th - 9th
Types:
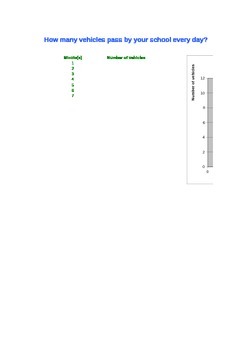
How many vehicles pass by your school every day? XLS Graph creator
This is an excel file that generate the graph for activity
"How many vehicles pass by your school every day?"
Also download the activity that goes along with this file
http://www.teacherspayteachers.com/Product/How-many-vehicles-pass-by-your-school-every-day-1659552
Subjects:
Grades:
6th - 12th
Types:
Showing 1-13 of 13 results


