227 results
Higher education statistics resources for Microsoft Word
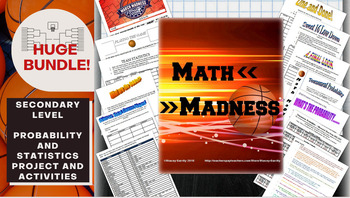
Math March Madness Full Tournament Project {BUNDLE}
Harness the excitement of NCAA March Madness with this huge project for secondary math teachers that follows all stages of the tournament! This Common Core aligned bundle comes with bonus parts not sold individually in my store so you can create a rich immersion in the tournament, practice probability and statistics and learn some interesting new ones along the way! Save $3 plus get bonus content by bundling!You can pick and choose which parts you would like to incorporate, or follow my schedu
Subjects:
Grades:
6th - 12th, Higher Education
Types:
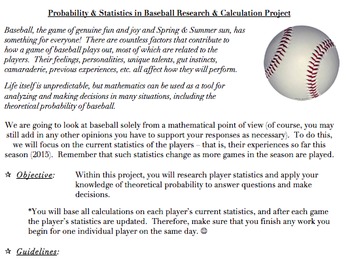
Probability & Statistics in Baseball Project (Common Core Aligned, AND FUN!)
The problems and activities within this document are designed to assist students in achieving the following standards: 6.SP.B.5, 7.SP.C, HSS.CP.A.2, HSS.CP.A.3, HSS.CP.B.7, HSS.CP.B.9, as well as the standards for mathematics practice and the literacy standards. They are also designed to help the teacher assess the students’ abilities when it comes to working with the ideas within the standards.This document contains the following:A project designed to allow students to investigate theoretical
Subjects:
Grades:
5th - 12th, Higher Education, Adult Education, Staff
Create Your Own Statistics Project
This document contains a statistics project description that allows students to create their own project. This is suitable for high school and beginning level college statistics class. Students will design their own study - formulate research questions, collect data, organize and summarize the findings, calculate confidence interval and construct hypothesis testing. Certain restrictions are outlined in the document. Students will experience the complexity of constructing their own study. They ar
Subjects:
Grades:
10th - 12th, Higher Education, Adult Education
Types:

Cards Probability Scavenger Hunt Activity
A mix of 26 addition rule, multiplication rule, and conditional probability questions about a standard deck of cards. Find the cards in question to lead you to the next problem! This resource is a word document so you may edit it to your liking. I made this activity for my CP Probability&Statistics class - but it is also challenging enough for an AP level statistics class. It generally takes about two class periods - but my kids LOVE it and it is GOOD practice. The problems may be a little t
Subjects:
Grades:
9th - 12th, Higher Education
Types:
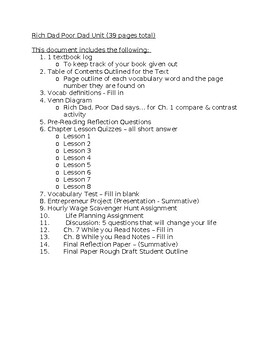
Rich Dad Poor Dad - ENTIRE UNIT (39 PAGES)!!!!!
The following is an ENTIRE UNIT for the book Rich Dad Poor Dad. It is a WORD DOC so you can edit it to your liking!This ENTIRE UNIT includes the following:1. 1 textbook log o To keep track of your book given out2. Table of Contents Outlined for the Texto Page outline of each vocabulary word and the page number they are found on3. Vocab definitions - Fill in4. Venn Diagram o Rich Dad, Poor Dad says… for Ch. 1 compare & contrast activity5. Pre-Reading Reflection Questions6. Chapter Lesson Quiz
Subjects:
Grades:
9th - 12th, Higher Education
Types:
Probability and Statistics March Madness Project
In this activity, students fill out a March Madness bracket by using the formula. Then, you will simulate each game to determine the winner. Then they fill out a March Madness bracket by selecting who you think will win. Let them do the research and discuss. It can be based on research of team and player statistics, the team name they like the most, the team mascot they like the most, or any other criteria they can think of! At the conclusion of the tournament, we will revisit this activity
Subjects:
Grades:
9th - 12th, Higher Education
Types:
The 57 Bus- Looking at Hate Crime Data
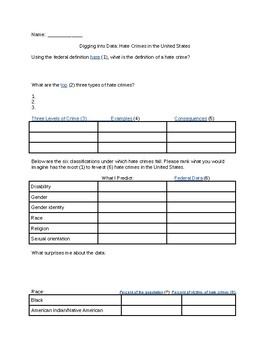
A guided web search on hate crime data from the FBI, CDC, Pew Research Center, and U.S. Census Bureau. Uses reflection questions to make conclusions and predictions about the distribution of hate crimes. The kids are fascinated by the data!
Subjects:
Grades:
7th - 12th, Higher Education, Adult Education
Types:
Measures of Central Tendency Review Mean, Median, Mode & Midrange
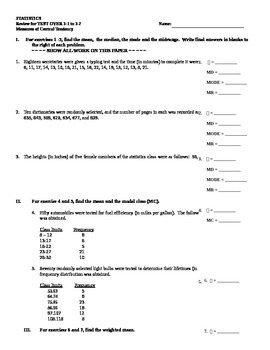
This worksheet reviews sections 3-1 and 3-2 of Bluman's Elementary Statistics textbook. Students are asked to calculate Mean, Median, Mode and Midrange for sets of data. They are also asked to find the mean and modal class for grouped frequency distributions, and weighted means. There is one question regarding the distribution of data.
Subjects:
Grades:
10th - 12th, Higher Education
Types:
Permutations and Factorial Notation Worksheet (17 Questions)
Permutations and Factorial Notation Worksheet17 Questions with the solutions1 page for the questions1 page for the answers* AlSO AVAILABLE FOR YOU OR A COLLEAGUE! - CLICK ANY LINK YOU WANT:Probability & OddsMean, median, mode, range, line plot, and Box and whisker WorksheetStatistical Math (GED REVIEW)The Binomial Theorem Worksheet (10Q)Theoretical Probability WorksheetProbability Word Problems (Worksheet) You may also be interested in my other top-selling products: EQUIVALENT FRACTIONS (33
Subjects:
Grades:
9th - 12th, Higher Education, Adult Education, Staff
Types:
AP Statistics Unit 4 Test- Probability
This is a unit test that covers all of the content for AP Statistics Unit 4: Probability, Random Variables, and Probability Distributions.This assessment contains 20 multiple choice questions and three free response questions. It models the exact format of the AP Statistics exam. The topics covered on this assessment include:- 4.1 Introducing Statistics: Random and Non-Random Patterns? - 4.2 Estimating Probabilities - 4.3 Introduction to Probability 3- 4.4 Mutually Exclusive Events - 4.5 Cond
Subjects:
Grades:
10th - 12th, Higher Education
Types:
AP Statistics Unit 3 Test- Collecting Data
This is a unit test that covers all of the content for AP Statistics Unit 3: Collecting DataThis assessment contains 20 multiple choice questions and two free response questions. It models the exact format of the AP Statistics exam. The topics covered on this assessment include:- 3.1 Introducing Statistics: Do the Data We Collected Tell the Truth? - 3.2 Introduction to Planning a Study - 3.3 Random Sampling and Data Collection- 3.4 Potential Problems with Sampling - 3.5 Introduction to Exp
Subjects:
Grades:
10th - 12th, Higher Education
Types:
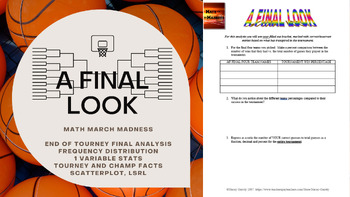
Math March Madness - A Final Look (Freq Distributions, Stats, Regression Lines)
Fill out a bracket, watch the tournament unfold and then mathematically analyze how you did! This activity is flexible enough to be used for a variety of levels. I have used all 6 pages for an AP Statistics class, and have used pages 1 through 5 for an Algebra or Algebra 2 class. You could even use it in lower levels as long as you are covering percents, and basic stats like mean, median, mode and graphing. The document is editable so you can adjust/delete to tailor to the level of statistic
Subjects:
Grades:
4th - 12th, Higher Education
Types:
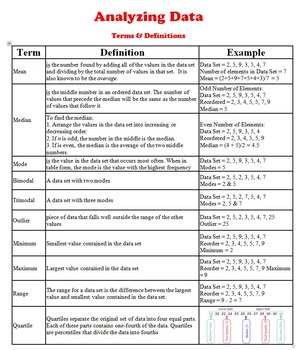
Data Analysis - Terms & Definitions (statistical measures definitions)
This Handout is part of : Maze - BUNDLE Statistical Measures (Mean, Median, Mode, & Range)
This handout is a quick reference sheet which includes the main definitions needed to introduce the data analysis terms in statistics. Terms such as: mean, median, mode, bimodal, outlier, minimum, range, quartile, box-and-whisker,.... etc. are some of the definitions shared on this handout.
Share it with your students, test them on it, and expect them to know it by heart. Those definitions are the
Subjects:
Grades:
6th - 12th, Higher Education, Adult Education
Types:
AP Statistics Unit 2 Test- Exploring Two-Variable Data
This is a unit test that covers all of the content for AP Statistics Unit 2: Exploring Two-variable data. This assessment contains 20 multiple choice questions and two free response questions. It models the exact format of the AP Statistics exam. The topics covered on this assessment include:- 2.1 Introducing Statistics: Are Variables Related? - 2.2 Representing Two Categorical Variables- 2.3 Statistics for Two Categorical Variables - 2.4 Representing the Relationship Between Two Quantitativ
Subjects:
Grades:
10th - 12th, Higher Education
Types:
AP Statistics Unit 1 Test- Exploring One-Variable Data
This is a unit test that covers all of the content for AP Statistics Unit 1: Exploring One-variable data. This assessment contains 20 multiple choice questions and two free response questions. It models the exact format of the AP Statistics exam. The topics covered on this assessment include:- 1.1 Introducing Statistics: What Can We Learn from Data?- 1.2 The Language of Variation: Variables - 1.3 Representing a Categorical Variable with Tables - 1.4 Representing a Categorical Variable with
Subjects:
Grades:
10th - 12th, Higher Education
Types:
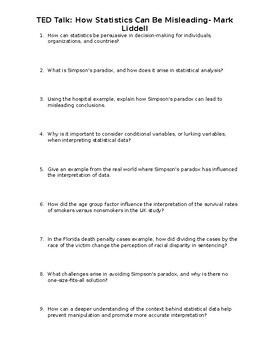
TED Talk: How Statistics Can Be Misleading- Mark Liddell
In this thought-provoking assignment, students will explore the fascinating world of statistics and the potential pitfalls of misinterpretation. Through a TED Talk titled 'How statistics can be misleading,' students will learn about Simpson's paradox, a phenomenon where aggregated data can lead to misleading conclusions when not properly analyzed.Using compelling examples such as hospital survival rates and legal sentencing disparities, students will discover how seemingly straightforward statis
Subjects:
Grades:
9th - 12th, Higher Education, Adult Education
Types:
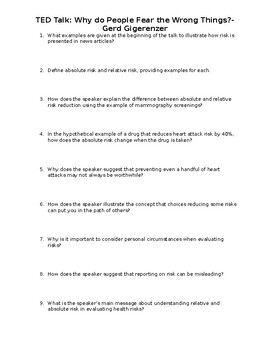
TED Talk: Why do People Fear the Wrong Things?- Gerd Gigerenzer
This assignment is based on a thought-provoking TED Talk that delves into the complexities of understanding health risks, particularly the difference between absolute and relative risk. Students will explore real-world examples, such as the impact of a new drug on heart attack risk and the increase in shark attacks, to grasp the significance of these concepts in evaluating risks.In this assignment, students will engage with the TED Talk through a set of 10 high school/college level questions tha
Subjects:
Grades:
9th - 12th, Higher Education, Adult Education
Types:
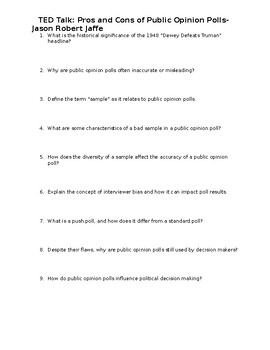
TED Talk: Pros and Cons of Public Opinion Polls- Jason Robert Jaffe
Engage your students in a thought-provoking exploration of public opinion polls with this captivating assignment based on an enlightening TED Talk. Students will delve into the complexities of polling, uncovering the reasons behind their inaccuracies and the factors that influence their results. Through a series of stimulating questions, students will examine the concept of samples, the impact of sample size and diversity, and the role of interviewer bias in shaping poll outcomes. They will also
Subjects:
Grades:
9th - 12th, Higher Education, Adult Education
Types:
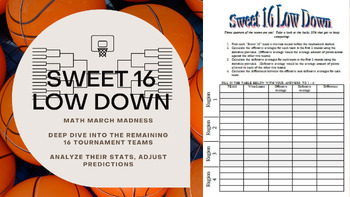
Math March Madness - Sweet 16 Low Down (Statistics Analysis of Final 16 Teams)
Join in the fun of the NCAA tournament at the Sweet 16 round! In this activity students analyze win percentages of the remaining 16 teams as well as research and compute their average offense and defense. This editable activity also asks students to analyze math presented in the real world by finding media and articles that use statistics to further their arguments.This can be used independently or check out these other items in my store for a comprehensive March Madness Project!Math March Mad
Subjects:
Grades:
4th - 12th, Higher Education
Types:
CCSS:
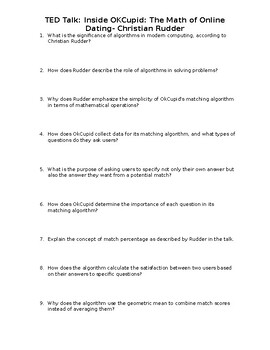
TED Talk: Inside OKCupid: The Math of Online Dating- Christian Rudder
Explore the fascinating world of algorithms with this engaging assignment based on Christian Rudder's TED Talk about OkCupid's matching algorithm. In this lesson, students will dive into the math behind OkCupid's approach to love and learn how algorithms are used to solve real-world problems.This assignment includes:A link to the TED Talk video12 high school/college-level questions to facilitate critical thinking and comprehensionAn explanation of how OkCupid's matching algorithm works, includin
Grades:
9th - 12th, Higher Education, Adult Education
Types:
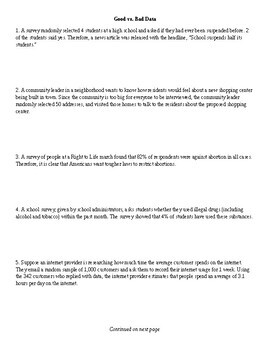
Identifying Types of Bias
Students apply their knowledge of bias to nine real-world scenarios by identifying the type of bias at play (if any) and demonstrating how the sampling technique in question fails to represent the population of interest. Can be used as classwork or homework; in my experience, it works best as a group activity where students can collaborate and discuss their thoughts.
Subjects:
Grades:
10th - 12th, Higher Education
Probability and Statistics Project Central Limit Theorem
See the connection between a Normal Distribution and the Central Limit Theorem with a fully detailed activity. Check out the preview. This is a detailed winner!Student centered, active, engaging, real, relevant is my style. I wrote this group project so you didn't have to!
Subjects:
Grades:
9th - 12th, Higher Education
Types:
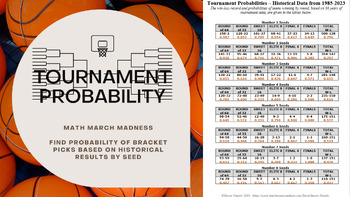
Math March Madness - Bracket Probabilities (Based on Historical Data by Seed)
One of the most interesting looks at predicting winners of the tournament! I have compiled data from 1985 (when the tournament went to 64 teams) through 2023 of the wins and losses by seed in the tournament. Students will use this data along with a bracket that they fill out to see what the probability is of their picks making it to various stages, their chances of all of their final four teams making it this year, and more! Very fun and very interesting answers! Students primarily use "And"
Subjects:
Grades:
6th - 12th, Higher Education
Types:
CCSS:
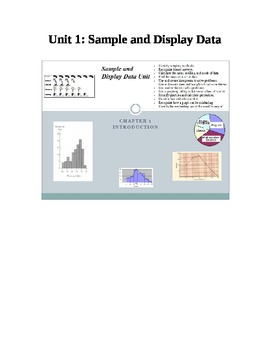
Sample and Display Data Unit
Sample and Display Data Unit
Includes learning objectives, vocabulary sheets, pre-test, test and retest.
Covers:
- Identify sampling methods.
- Recognize biased surveys.
- Calculate the mean, median, and mode of data.
- Find the range of a set of data.
- Use and create histograms to solve problems.
- Use and create stem and leaf plots to solve problems.
- Use scatter plots to solve problems
- Use a graphing utility to determine a line of best fit.
- Identify quartiles and calculate percentil
Subjects:
Grades:
5th - 12th, Higher Education, Adult Education, Staff
Types:
Showing 1-24 of 227 results


