119 results
3rd grade statistics resources for Microsoft Word
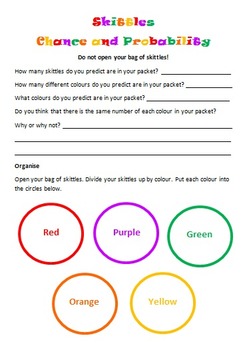
Skittles Chance and Probability (Editable)
Chance and Probability activity using yummy Skittles!!!
Students are to predict the colours and quantities before they open the skittles bag. Students are to complete a chance experiment where they use a tally to collect their data. Students then transfer their data in fractions, decimals and percentages. Students are to create a bar graph using their data as well as answer chance and probability questions about the data. I used this with my grade 5/6 students and they loved it!
Subjects:
Grades:
3rd - 10th
Types:
My Lego House
This is a 2-3 week maths project for anyone from Grade 3-6. Done in pairs or small groups the project entails students designing and building their own Lego house. In the project students will cover a range of maths concepts including area, perimeter, counting, money, graphing and interpreting data. The project includes a detailed teacher booklet with photographs of student's work and examples for each of the lessons. The student book is also included for students to work from, although we found
Subjects:
Grades:
3rd - 6th
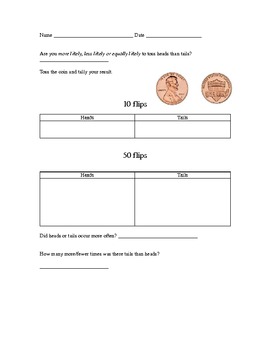
Probability: coin toss and dice roll
Teach probability using a penny and/or a dice. Introduce this probability game using key vocabulary: more likely, less likely or equally likely. Students will be able to practice using tally marks during the recording process.
Students will toss a penny 10 or 50 times and record the number of times heads or tails lands facing up. Students will roll a dice 10 or 50 times and record the number of times a even or odd number lands facing up.
Subjects:
Grades:
K - 4th
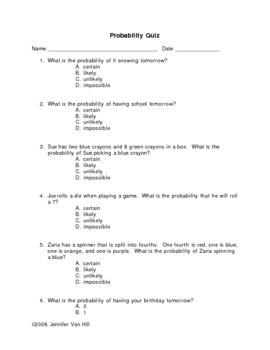
Probability Quiz
This is a probability quiz that focuses on identifying probability in the terms of certain, impossible, likely and unlikely. This quiz is in the format of of multiple choice and constructed response questions. An answer key is also provided.
Jennifer Van Hill
Subjects:
Grades:
3rd - 5th
Types:
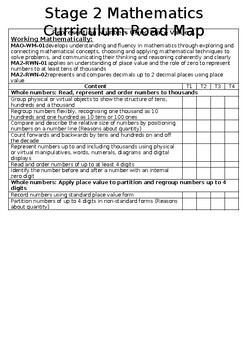
NSW STAGE 2 MATHEMATICS CURRICULUM ROADMAP (NEW K-6 SYLLABUS)
Template of a Stage 2 Roadmap for the new NSW Mathematics SyllabusThis template has a simple layout that will allow you to highlight the different Mathematic learning areas to cover throughout the year. It covers the content areas in Part A and Part B. It is organised in a way that is reflective of the live document from the NSW Curriculum website.A great tool to use for your staff planning days at the beginning of the year or each term.
Subjects:
Grades:
3rd - 4th
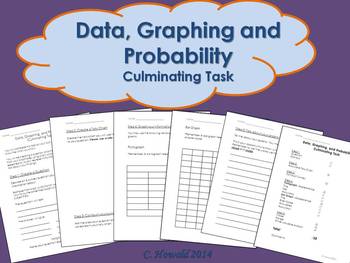
Graphing Unit Culminating Project
I used this activity as a summative assessment for my Data, Graphing and Probability Unit. This gave students the opportunity to create their own question, survey a group of students (visited another class in the school), collect, display and analyze their data.
I have left this as a .doc file so that you are able to adjust it to fit the needs of your classroom.
If you have any questions or concerns, let me know!
Thanks for downloading. Please take the time to rate this product.
If you e
Subjects:
Grades:
2nd - 4th
Types:
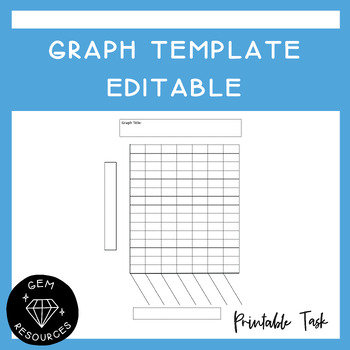
Graph Template Data and Statistics Maths Histogram Bar Column Drawing Editable
Students can use this to help them draw up a graph. It allows them to be accurate and has boxes for the titles needed for the graph.This Word document is editable.
Subjects:
Grades:
2nd - 6th
Types:
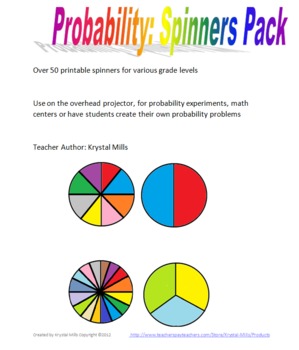
Probability Spinners Pack
This resource includes spinners for probability problems and experiments that could be used in various grades.
Included:
-blank spinners (2,3,4,5,6,8,10 and 16 spaces)
-numbered spinners (2,3,4,5,6,8, and 10 spaces)
-printable sheets (4 spinners to a page) of blank spinners with 2,3,4,5,6,8,10 and 16 spaces
-colored spinners (2,3,4,5,6,8,10 and 16 spaces)
Over 50 spinners that can be used with various grades and for various activities. Ready to print and go!
Teacher Author: Krystal Mills
pr
Subjects:
Grades:
3rd - 8th
Types:

AFL Footy Maths Investigation Fractions Percentage
This task is super engaging and a practical, real-world application of fractions and percentages.
My students really grasped a good understanding of the connection between fractions and percentages as a result of this task.
Subjects:
Grades:
3rd - 6th
Types:

Mean, Median, Range, Mode Quiz
This is a five problem math quiz. It can be used for a quiz, but also as a review. There are five sets of numbers where students must find the mean, median, range, and mode of each data set. The numbers are not in numerical order.
Subjects:
Grades:
3rd - 8th
Types:
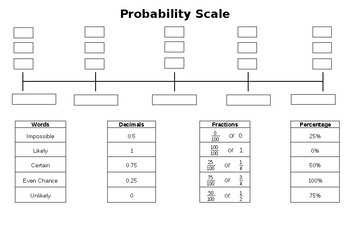
Probability Scale (Editable)
Students are to write the:
- Fractions
- Decimals
- Percentages
- Words
on the correct section of the probability scale.
Subjects:
Grades:
3rd - 8th
Types:
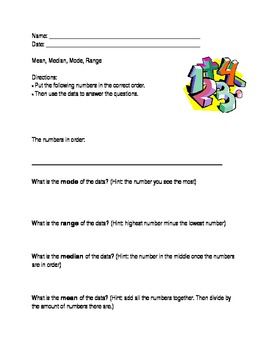
Mean, Median, Mode, Range; Modified Special Ed Math Template; Statistics
This is a modified worksheet from the middle school statistics curriculum. It is excellent for special education students who require an alternate or modified curriculum.
This worksheet allows teachers to input numbers in the blank space. This way teachers can use the template over and over with different numbers. Students are then to write the numbers in the correct order. Then, they have to find the mean, median, range, and mode. There are "hints" (formulas) that help the students differentia
Grades:
PreK - 12th
Types:
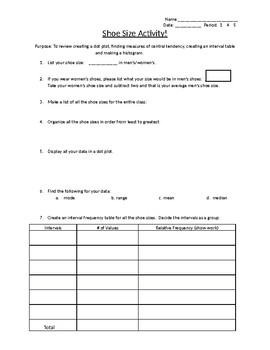
Shoe size group activity! Review dot plots and histograms.
This activity was created as a review for creating a dot plot, finding measures of central tendency, creating an interval table and making a histogram. All these items are covered in this group activity for your class! Kids enjoy working together while reviewing and learning all at one time.This is a word document that you change change anyway to fit your classes needs.
Subjects:
Grades:
3rd - 12th
Types:
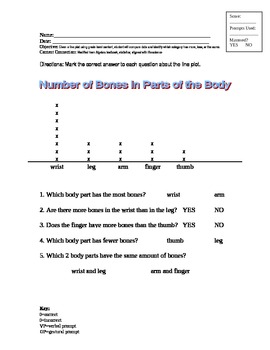
Reading a Line Plot; Modified Curriculum for Special Ed, Statistics
This line plot is modified from the middle school statistics curriculum. It is excellent for special education students who require an alternate or modified curriculum. The line plot is related to life science, and shows how many bones are in five different parts of the body. The questions on the worksheet ask questions about more and less. The answers are offered in a field of two.
This worksheet aligns with Maryland content standard:
Given a line plot using grade level content, student will c
Subjects:
Grades:
PreK - 5th
Types:
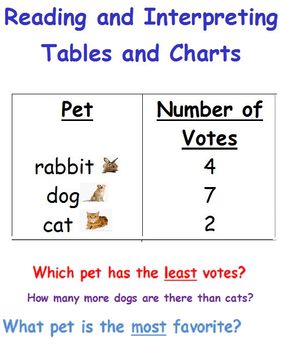
Reading a Table-Data and Statistics-First Grade
There are 4 different worksheets in which students can interpret the data of various tables. I hope they are of help to you! :)
Subjects:
Grades:
K - 3rd
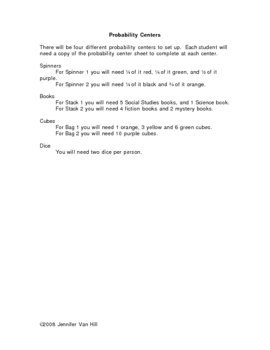
Probability Centers
This is a set of four probability activities that can be used individually or as centers. Students complete the activity and identify the probability of certain outcomes as likely, unlikely, certain or impossible.
Jennifer Van Hill
Subjects:
Grades:
3rd - 5th
Types:
Halloween Party - Math Problem Solving
In this activity, students will be planning a Halloween party for their class. They will need to "purchase" supplies for their party using a budget that you set. I set a budget that forces the students to make budget choices, i.e., I don't give them enough to buy everything they want. Students will work in partners to plan their party, making decisions based on their budget constraints. Students are also asked to perform some data analysis on the party choices. This is a good activity to do
Subjects:
Grades:
3rd - 7th
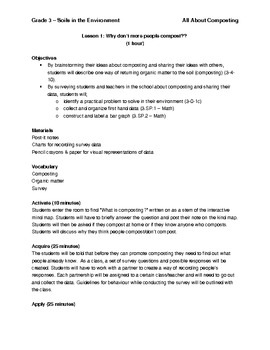
All About Composting - Grade 3 Statistics & Science Integrated Unit
This unit integrates Math Strand on Stats and Probability with the Science Unit on Soils. The focus of this unit is composting.
The unit has students survey other students about composting, create composters and conduct an experiment, and then promote their learning.
This unit includes worksheets and assessment tools.
Subjects:
Grades:
3rd
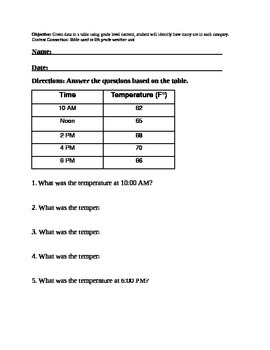
Reading Data in Table: Temperature. Special Ed
Aligns with the following Maryland State Alternate Content Standard:
Given data in a table using grade level content, student will identify how many are in each category.
This is a great assignment to do for homework or as a warm-up.
This worksheets uses a table from the modified curriculum for 6th grade earth and space science, weather.
Subjects:
Grades:
3rd - 12th
Types:
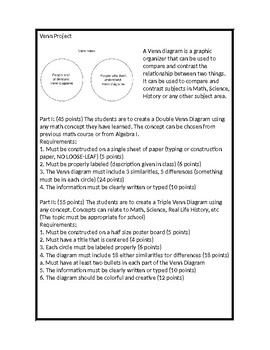
Venn Diagram Project
A Venn diagram is a graphic organizer that can be used to compare and contrast the relationship between two things. It can be used to compare and contrast subjects in Math, Science, History or any other subject area.
Subjects:
Grades:
3rd - 12th
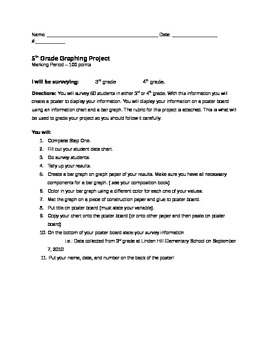
Graphing and Surveying Project
A graphing and Surveying Project for students to get a better idea of how to create different types of graphs. I have used this with fourth and fifth grades and it was fantastic!
The attachment includes: Step by Step directions for the project, a brainstorming sheet, a chart to take the survey on, a written response sheet, and a rubric to grade students.
Graphing and Surveying Project is licensed under a Creative Commons Attribution 3.0 United States License.
Subjects:
Grades:
3rd - 6th
Types:
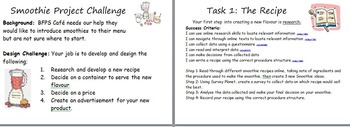
Smoothie Project integrated, capacity, money, data, recount, persuasive
Integrated cross-curriculum project.
Included;
* Project instructions
* Success Criteria linked to Australian Curriculum
* Teacher Notes
Project is linked to;
Maths - Data, Measurement: Capacity, Money,
English - Online navigation and research, Procedure and Persuasive texts.
Project Outline:
Students will undertake research into developing a new smoothie, throughout this project students must work as a team to create a new recipe, decide on a container, cost and advertising platform.
Subjects:
Grades:
3rd - 6th
Types:
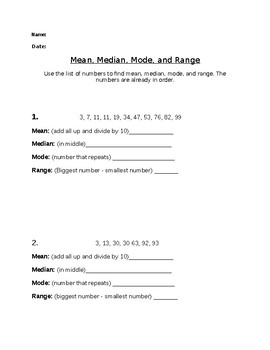
Mean, Median, Mode, and Range
This is a worksheet that allows for practice of mean, median, mode, and range. The numbers are already in order and definitions for each term are provided.
Subjects:
Grades:
3rd - 10th
Types:
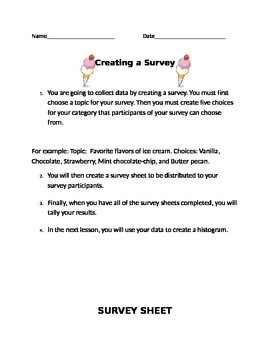
Creating a Survey, Tallying Results and Creating a Histogram, Box Chart
This activity includes a general student instruction sheet, a brainstorming activity to choose categories for students' survey topics, a blank survey sheet to be filled out and distributed to the population sample, a worksheet to tally the results of the survey and a worksheet to create a histogram or box plot for the survey results. This activity may be completed individually or in small groups.
Subjects:
Grades:
3rd - 6th
Types:
Showing 1-24 of 119 results


