46 results
Not grade specific statistics resources for Microsoft Word
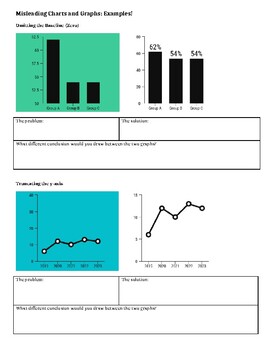
Misleading Charts and Graphs Analysis
This lesson outlines the four most common ways that writers and journalists display graphs that can cause people to draw incorrect conclusions. Students look at examples of bad graphs along with corrected versions and explain why one version is misleading and the other is correct. Independent practice is provided for the students to demonstrate understanding as well.
Subjects:
Grades:
Not Grade Specific
Types:
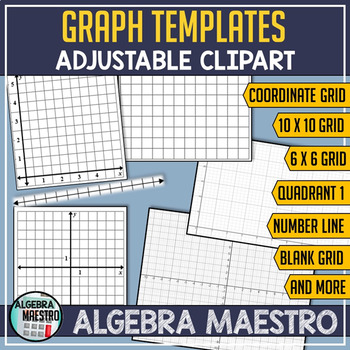
Adjustable Graph Templates
With Adjustable Graph Templates you'll receive a variety of graphs that are formatted to be easily adjustable, this is to help you create your own assignments. The full-page templates can be used as cut-outs, very useful for Foldables, and Interactive Notebooks. There are a variety of graph templates: coordinate axis (axes), 1st quadrant, number line, grid - and with a variety of units and sizes to suit your needs. To adjust a graph - click the desired graph and adjust the size by selecting-
Subjects:
Grades:
Not Grade Specific
Types:
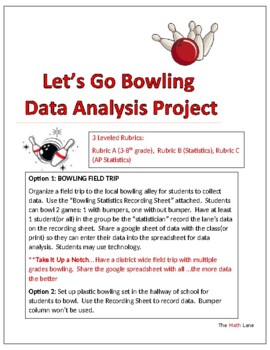
Let's Go Bowling Statistics STEM Project & Field Trip (3-12 and AP Stat)
Great END OF YEAR project. Get ready to strike up some fun with your students on a field trip to the bowling alley or right in your own hallway with a plastic bowling set! This isn't just any ordinary field trip - it's a real-world data collection extravaganza. 3 different leveled rubrics (Grade 4-10, Statistics, AP Statistics) so students can analyze the data based on their math knowledge. Students will be able to practice creating and analyzing graphical displays, scatterplots, construct c
Subjects:
Grades:
Not Grade Specific
Types:
Also included in: High School Statistics Project Bundle
Statistics Multiple Choice Exams; Randomized & Preselected Qs
These are the available tests.Statistics Review (40 Random Qs)Multiple Choice Exam 01 (40 Preselected Qs)Multiple Choice Exam 02 (40 Preselected Qs)Multiple Choice Exam 03 (40 Preselected Qs)The download will have the URL, username, and password to the Canvas online testing system.After you log in, you will be able to take the stats assessmentsYour account will stay active for 6 monthsIf you use Canvas as your testing platform, this quiz can be installed, administered, will self-grade, and updat
Subjects:
Grades:
Not Grade Specific
Types:
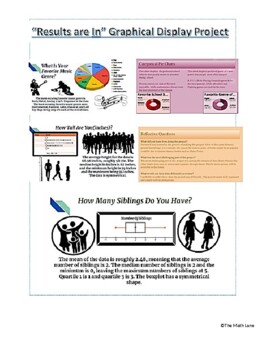
"The Results are In" Graphical Display Stats End of Year Project (All Grades)
Get ready to take your data analysis skills to the next level with our Graphical Display Project! Designed for students who want to create visually stunning displays of their data, this project allows you to not only collect data using Google Surveys, but also analyze and present it using Google Sheets. With detailed instructions, project examples, and a comprehensive rubric included, you'll have everything you need to create professional-looking graphical displays of both numerical and categori
Subjects:
Grades:
Not Grade Specific
Types:
CCSS:
Also included in: High School Math Projects (Algebra II and Statistics) STEM No prep
Winter Themed Holiday Glyphs
These themed holiday glyphs include an elf, snowman, and reindeer. Use these glyphs as a single lesson on data collection, or refer back to them again and again. These engaging glyphs address skills like following instructions, collaboration, data collection, and analytical skills. Whether you are a seasoned vet with glyphs or trying them for your first time these FULLY CUSTOMIZABLE glyphs can be altered to fit the needs of any class or grade.
Subjects:
Grades:
Not Grade Specific
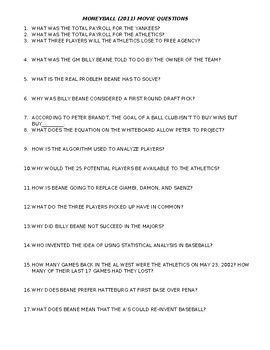
Moneyball (2011) Movie Questions
Moneyball (2011) Movie Questions: short response questions that accompany the 2011 film starring Brad Pitt, Moneyball. Questions are in chronological order, and activity would be great for an Economics or Statistics class.
Subjects:
Grades:
Not Grade Specific
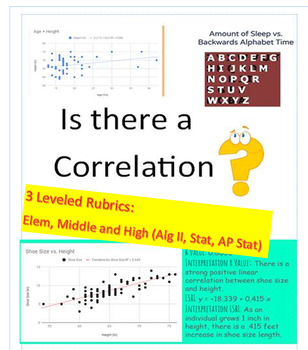
Correlation? Data Project (3 Rubrics_Elem/Middle School/ AP Stats) EOY
Get ready to supercharge your students' data analysis skills with this dynamic project! Perfect for end of year or semester project. In this engaging activity, students will have the exciting opportunity to collect their own data through surveys, online research, or real world data sets. They will then dive deep into the world of statistics as they determine if there is a correlation between two variables. With three different leveled rubrics, this project is perfect for students of all ages an
Subjects:
Grades:
Not Grade Specific
Types:
CCSS:
Also included in: High School Math Projects (Algebra II and Statistics) STEM No prep
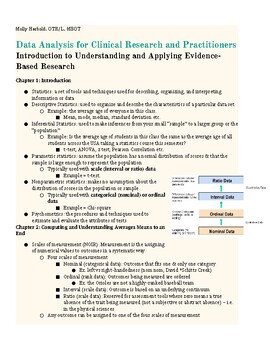
Editable Clinical Research/ Data Analysis Lecture Notes for a Full Semester!
I created this editable lecture material and study guide while taking Data Analysis in graduate school for my master's in occupational therapy. This simple-to-understand guide looks over the basics of research while applying the basics using a clinical lease. This study guide is excellent for all students taking introductory statistics courses, data analysis, or clinical research. The specific graduate programs that would benefit from this include but are not limited to:Occupational TherapyPhysi
Subjects:
Grades:
Not Grade Specific
Types:
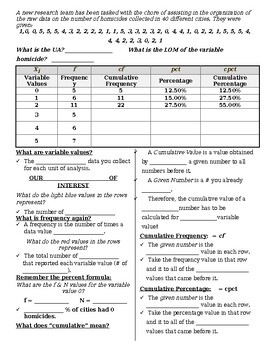
Univariate Stats: Frequency Distribution Table, Scaffolded Notes, Animated PPW
This Univariate Stats: Frequency Distribution Table resource contains scaffolded note pages that correspond to an interactive PowerPoint for your scientific method or statistics unit. There is a Tip & Tricks slide and corresponding note page that compiles feedback, notes, and helpful information I have personally seen benefit my students.Please be aware that this lesson was designed for a criminal justice-based statistics course; as such, topics and applied word problems use related themes.S
Subjects:
Grades:
Not Grade Specific
CCSS:
NGSS:
MS-LS4-6
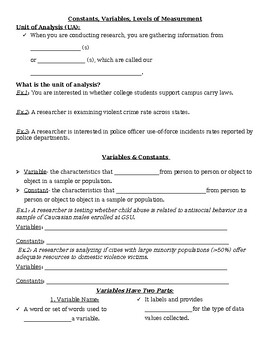
Constants, Variables, & Level of Measurement Scaffolded Notebook Pages
This constants, variables, and level of measurement resource contains scaffolded note pages that correspond to an interactive PowerPoint for your scientific method or statistics unit. There is a Tip & Tricks slide and corresponding note page that compiles feedback, notes, and helpful information I have personally seen benefit my students.Please be aware that this lesson was designed for a criminal justice-based statistics course; as such, topics and applied word problems use related themes.S
Subjects:
Grades:
Not Grade Specific
CCSS:
NGSS:
HS-LS3-3
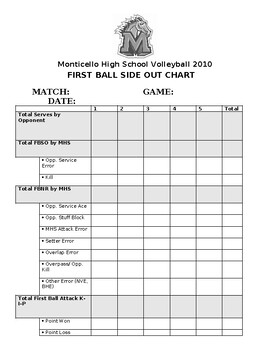
Volleyball - First Ball Side Out Stat Sheet
This stat sheet will help you track serve receive statistics based on the first ball your team receives. You will be able to track FBSO options for points you earn, balls you kept in play, and opposite team points earned. This provides valuable information that allows you to determine if changes need to be made in serve receive or offensive playsets.
Subjects:
Grades:
Not Grade Specific
Types:

Term Maths Planning. Topics include: Money, Stastics, Fractions and Decimals.
Term lesson planning, topics include; money, statistics, fractions and decimals. Designed to introduce students to the topic. Differentiation for more HA (able) students.
Suitable for KS1, Pre K, Grade 1-6 and Students with Special Educational Needs.
Thank you and happy teaching....
Subjects:
Grades:
Not Grade Specific
Types:
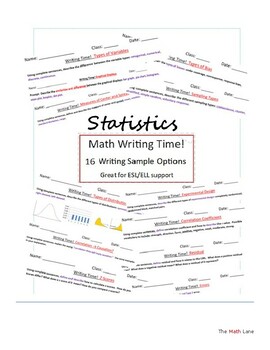
Math Writing Time! Statistics (16 prompts) ESL/ELL/TELPAS
16 math writing samples over Statistics concepts. Writing topics include types of variables, graphical displays, types of distributions, measures of center and spread, sampling types, types of bias, experimental design, correlation coefficient, correlation and causation, residual, z scores, hypothesis tests, errors, mean difference vs difference of means, Chi Square tests. Great for ESL/ TELPAS writing samples.Check out The Math Lane's other Writing Time:-Alg I/Alg II Writing Time!-Geometry W
Subjects:
Grades:
Not Grade Specific
Types:
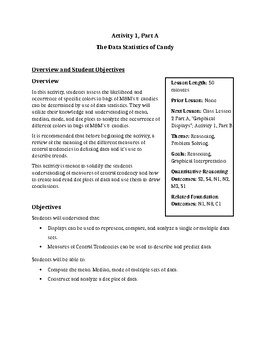
Data Statistics with Candy
This is a 4 activity lesson. It was created to follow along with The Dana Center Quantitative Reasoning resources but can be used as a stand-alone activity series. Provided are lesson plans with activity papers for students to complete work on. The lesson activities follow each other well and were created to develop a student's understanding of the basics of data statistics including measures of central tendency, box and whisker plots, cumulative curve percents, and even probabilities. The activ
Subjects:
Grades:
Not Grade Specific

Time Consuming Puzzles
This activity is a unique great puzzle game aimed at training students to think multiple steps ahead. To solve each puzzle you must use numbers, logic and even a little bit of luck, to predict how the hands of the clock will rotate and eliminate all the numbers. Think of it like a Mathematical, pen-and-paper version of Candy Crush.It is a simple puzzle to implement during your study of topics such as Time, Numbers and Statistics.Your students will have a great time solving these for themselves a
Subjects:
Grades:
Not Grade Specific
Types:
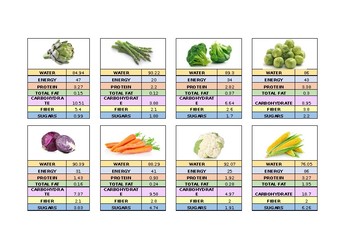
Food Content Cards
SCIENCE
These cards make an excellent hook into the topic of healthy eating if used as Top Trumps game.
COOKING
These cards are useful for healthy eating because it is in the overlap between cooking and science.
MATHS
- Top trumps cards themselves are also useful for number ordering lessons, and they do bring awareness of healthy eating as a cross-curricular link.
- As a more interesting source of information for statistics projects, which rather could be stuck around the room so statistics ga
Subjects:
Grades:
Not Grade Specific
Types:
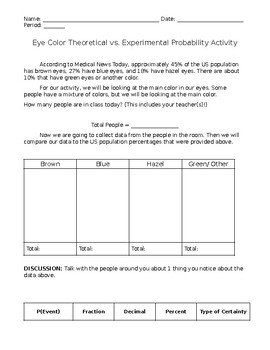
Theoretical vs. Experimental Probability Activity - Word Version
FREE - Take it and modify it as you need!Quick and interactive activity for theoretical and experimental probability.Students will use theoretical data (historical data) and experimental data to determine the probability of selecting a person with a certain eye color.This can be done with a large group of students or as a class. Students will need to know:How to collect dataHow to calculate P(Events)Types of certaintyImpossible - 0%Unlikely - 0-50%Equal Chance - 50%Likely - 50-100%Certain - 100%
Subjects:
Grades:
Not Grade Specific
Types:

CLOSED ECONOMY- ONE PERIOD MODEL OF ECONOMY
Concise and to the point lessons about the Closed Economy One period Model
Subjects:
Grades:
Not Grade Specific
Types:
Math Carnival Game - Duck Pond - Statistics
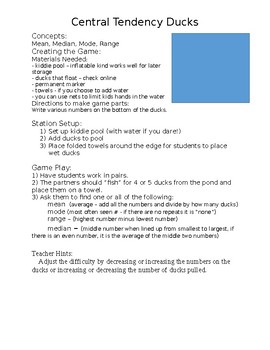
Students practice mean, median, mode, and range by pulling ducks from a carnival themed duck pond game. This game can be used as a stand alone in a math center or as one of many games in a math carnival as my school does. You can adjust the difficulty by the numbers on the ducks, how many ducks the students take, and what specific type of statistic you require.
Subjects:
Grades:
Not Grade Specific
Types:
Also included in: Math Carnival Games Bundle

"Moneyball" Discussion Questions
Discussion questions for students watching the movie "Moneyball"
Subjects:
Grades:
Not Grade Specific
Types:
Rates and Percent with Sports Statistics
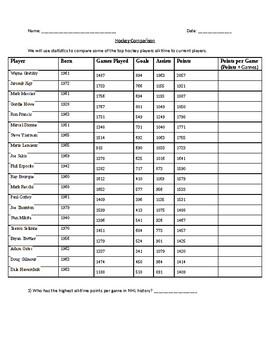
Real All-Time hockey and boxing statistics to teach rates and percent.
Subjects:
Grades:
Not Grade Specific
Types:
Statistical Hypothesis Testing Notes-Paired t-Test-Independent Pop. Two Tail
A detailed walkthrough of how to conduct a paired t-Test hypothesis testing with two independent populations for statistical analysis.
Subjects:
Grades:
Not Grade Specific
Types:
Also included in: Statistical Hypothesis Testing Notes ~BUNDLE~
Ice Cream Data Collection
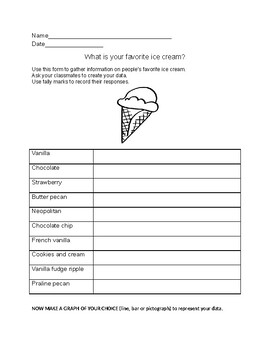
Collect real time data!!!! Then make a graph (line/bar graph template included, but .you can take it further!)Build those early statisticians! And let them eat....Ice cream!
Subjects:
Grades:
Not Grade Specific
Showing 1-24 of 46 results


