16 results
Higher education statistics resources for Easel
![Preview of Statistics Final Exam and Review [AP, College, and Honors]](https://ecdn.teacherspayteachers.com/thumbitem/Statisticis-FinalReviewStudy-Guide-Exam-1711356723/original-699492-1.jpg)
Statistics Final Exam and Review [AP, College, and Honors]
You can use this Statistics Final Exam in an AP Statistics, Honors Statistics, or a College Statistics course as an assessment, review or both. What's Included?Included are 6 different versions, each including 60 well chosen representative questions in both multiple choice format and also in free response format*. These reviews and tests work well in class or as a take- home. The tests are editable with Adobe Acrobat Pro. Each test should take about 2 - 3 hours and can be taken with a graphin
Subjects:
Grades:
10th - 12th, Higher Education
Types:
CCSS:
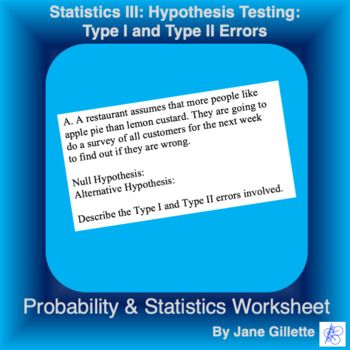
Statistics III: Hypothesis Testing: Type I and Type II Errors
Presents a series of situations, without numbers, then asks questions about null and alternative hypotheses and meanings of type I and II errors.This is ready to print, or to assign as an online Easel Activity. The digital version is ready-to-use, but you can edit the instructions and locations of answer boxes to fit your needs.
Subjects:
Grades:
11th - 12th, Higher Education
Types:
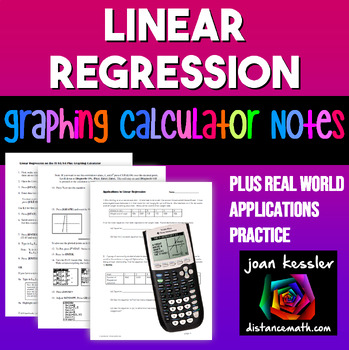
Linear Regression | TI-84 Graphing Calculator plus Applications
This clear, concise, step by step notes help your students use the TI 83 and TI 84 Graphing Calculator to enter data into lists, create a linear regression equation and to plot the equation along with the data simultaneously. Also included is a 3 page worksheet with five real world examples for students to practice. Solutions included. These can be used as Binder Notes or printed smaller for Interactive Notebooks._________________________________________________Related Products★ Quadratic Re
Subjects:
Grades:
9th - 11th, Higher Education
Types:
CCSS:
Also included in: Linear Functions and Systems Algebra 2 Unit 2 Activity Bundle
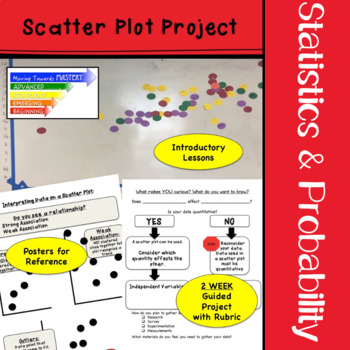
Scatter Plot Project End of Year Math Activity with Real World Data
TWO Week guided project for constructing and interpreting scatter plots. This engaging scatter plot project is individualized to allow students to research areas of interest. This project is great for a math end of year activity but it can also be used year round! Students will gather data on their topic of choice and use the project plan to organize their data into a scatter plot. Students will then analyze the results of the data collected.Six posters to guide students as they work independent
Subjects:
Grades:
8th - 10th, Higher Education
Types:
CCSS:
Also included in: Middle School Math Projects for End of the Year Activities
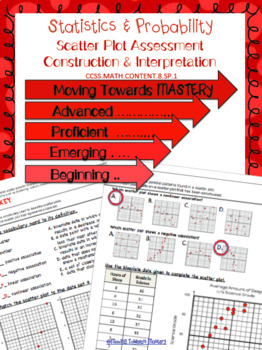
8.SP.1 Scatter Plots: Construction & Interpretation Assessment
Assessment for Scatter Plots: Construction & Interpretation that measures understanding at various levels of mastery to identify at what level students have progressed. Levels of mastery are:→ Beginning → Emerging→ Proficient→ AdvancedEASY printing with answer key--------------------------------------------------------------------------------------------------------------------------------------------------------------These printable worksheets can also be used as digital resources through t
Subjects:
Grades:
8th, Higher Education
Types:
CCSS:
Also included in: 8th Grade Common Core Statistics & Probability Assessments
Easy Statistics: Calculating Variance and Standard Deviation
Statistics has always been a different subject. Some people do not like it because math is involved. Some people do not like it because it is not traditional math like algebra. It has been my experience that statistics is easier by creating step-by-step instructions. And that is how this publication has been designed. In this publication I provide steps to calculating both the population standard deviation and the sample standard deviation. Although most calculators (and spreadsheets) have a fu
Subjects:
Grades:
10th - 12th, Higher Education, Adult Education
Types:

Z-Scores - Multiple Choice Questions
Digital/Printable - Twenty Multiple Choice Questions on Z-Scores!Tests basic calculation of Z-Scores, word problems & conceptual understanding of what Z-Scores mean. Product includes answer key. © The Stat Cat 2021
Subjects:
Grades:
10th - 12th, Higher Education
Types:
Easy Analytics: Basic Forecasting
Forecasting is a term that carries some baggage with it. When the term is used, many people often think of weather forecasting and how right or wrong it can be. Forecasting can also be used to predict anything that can be measured. There are sales forecasts, interest rate forecasts, and population forecasts to name a few. With that being said, forecasts are never perfect. We do not have crystal balls or oracles that can tell us exactly what will happen. However, usually we do not need perfect; w
Subjects:
Grades:
10th - 12th, Higher Education, Adult Education
Types:
Also included in: Easy Analytics: Basic Forecasting Bundle
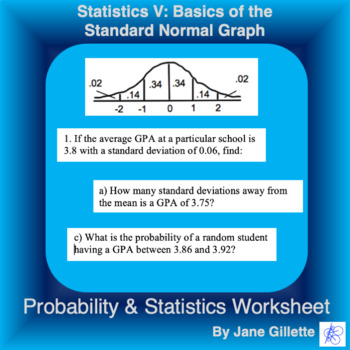
Statistics V: Basics of the Standard Normal Graph
Practice using a simplified (68/96/100%) standard normal graph to find standard deviations and probabilities of "nice" numbers.This is ready to print, or to assign as an online Easel Activity. The digital version is ready-to-use, but you can edit the instructions and locations of answer boxes to fit your needs.
Subjects:
Grades:
11th - 12th, Higher Education
Types:
CCSS:
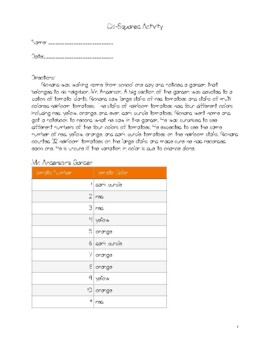
Chi-Squared Test Activity
Chi-Square Test Activity. This is a great step-by-step activity for calculating the chi-squared test by hand. This resource includes 5 pages and answer key. This is a relatively easy example to learn the basic concepts of Pearson's Chi-Square. This will help students understand a step-by-step approach. Feel free to leave a review and let me know how you like this resource!
Subjects:
Grades:
6th - 11th, Higher Education
Types:
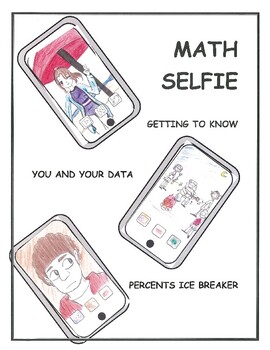
Distance Learning Math Activity You and Your Smart Phone Data
Create a Math Selfie and Use Percentages to uncover your data usage on our Smart Phone!Have the students create their picture and send it to you via email. Create a collage on your computer and send it back to them to create a sense of togetherness during social distancing.
Subjects:
Grades:
6th - 12th, Higher Education, Adult Education
Types:

Census Demographic Data Internet Activity and Activity
Students collect, analyze and investigate Demographic Census Data in a compounding assignment mad for online activities or project based presentations.. Students will find resources and information from online examples to demonstrate their understanding and analysis about topics and issues on political demography. Independent or group based activity made for online or in person completion of activity. Self guided instructions with links and resources included for students to use as necessary to
Grades:
9th - 12th, Higher Education, Adult Education
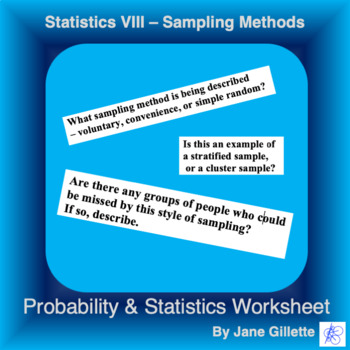
Statistics VIII - Sampling Methods
This worksheet practices identifying sampling methods, including voluntary, convenience, simple random, cluster, and stratified. It also asks students to identify who gets left out with voluntary or convenience samples.This is ready to print, or to assign as an online Easel Activity. The digital version is ready-to-use, but you can edit the instructions and locations of answer boxes to fit your needs.
Subjects:
Grades:
11th - 12th, Higher Education
Types:

You SnooZe, You Lose! - 60 Task Cards about Z-Scores - Digital Product
Digital/Printable task cards about Z-Scores - With Answer Sheet60 Task Cards ask students to: * Calculate the Z-Score* Calculate the Standard Deviation* Calculate the Mean* Calculate a Data Point* Think Critically about Z-Scores and what they mean©The Stat Cat
Subjects:
Grades:
10th - 12th, Higher Education
Types:
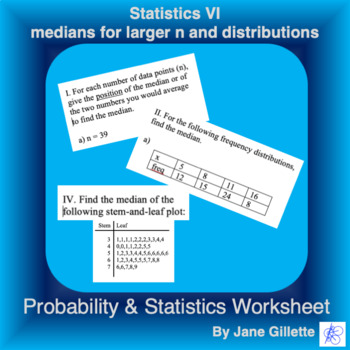
Statistics VI - medians for larger n and distributions
Part I: Given only n, find the position of the median or the positions of the two numbers you would average to find the median. Part II: Given a frequency diagram, a stem-and-leaf plot, or a list of numbers, find the median.This is ready to print, or to assign as an online Easel Activity. The digital version is ready-to-use, but you can edit the instructions and locations of answer boxes to fit your needs.
Subjects:
Grades:
10th - 12th, Higher Education
Types:
CCSS:
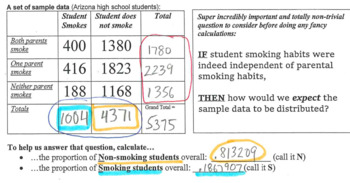
Statistics practice: chi-square test of independence
In the context of parent/student smoking habits, students practice the chi-square test of independence for a two-way table. Includes answer KEY.
Subjects:
Grades:
9th - 12th, Higher Education
Types:
Showing 1-16 of 16 results


