33 results
Higher education statistics resources for Microsoft Excel
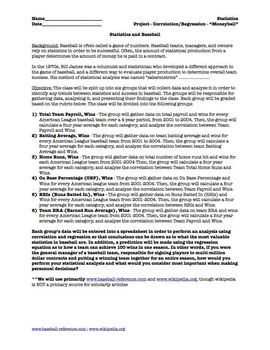
Statistics Correlation and Regression Project for Movie "Moneyball" (5 day)
Prerequisite: Correlation and Regression (Linear). This is a project that divides a statistics class into 6 groups and students do ACTUAL data collection from given websites and they perform their OWN ANALYSIS. They will use computers/internet/excel/spreadsheets/graphing calculators to evaluate correlation. If you have interest in baseball and statistics, this is a great project to get the class interested, and covers about 5 days, plus you can watch the movie "Moneyball" afterwards as a reward.
Subjects:
Grades:
10th - 12th, Higher Education, Adult Education
Types:
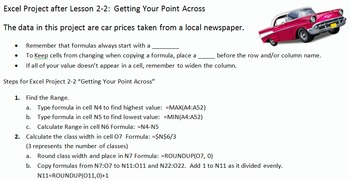
Excel Projects for Statistics Frequency Distributions and Charts
This file contains three different projects with solutions and a quick reference card for students. It correlates to Bluman's Elementary Statistics textbook.
First is an Introduction to Excel. There is an example, guided practice and then 4 Projects. The instructions are on each sheet. The topics covered are: basic editing and formatting, beginning charts, beginning formulas, such as SUM and AVERAGE, and calculations. There is an editable grading rubric for this project. The Preview file
Subjects:
Grades:
8th - 11th, Higher Education, Adult Education
Types:
Statistics Unit 9 Bundle - Hypothesis Testing (one sample) (18 days)
This is a unit plan bundle for a Statistics class. The plans include common core math standards, time frame, activities, enduring understandings, essential questions, and resources used. It is designed to last 18 days, depending on pacing. The plans include: 56-slide presentation, with annotated guide for reference5 Worksheets1 "Read & Respond" Article Worksheet2 Quizzes"Do Now" Entrance problemsSpreadsheet Activity - Hypothesis TestingReview slides (for peer presentations)Unit ReviewUnit Te
Subjects:
Grades:
10th - 12th, Higher Education
Types:
CCSS:
Statistics Unit 8 Bundle - Confidence Intervals (19 days)
This is a unit plan bundle for a Statistics class. The plans include common core math standards, time frame, activities, enduring understandings, essential questions, and resources used. It is designed to last 19 days, depending on pacing. The plans include: 52-slide presentation, with annotated guide for reference5 Worksheets3 Quizzes"Do Now" Entrance problemsSpreadsheet Activity - T-DistributionReview slides (for review response system)Unit test (with review packet)Unit Project - Gather Data,
Subjects:
Grades:
10th - 12th, Higher Education
Types:
CCSS:
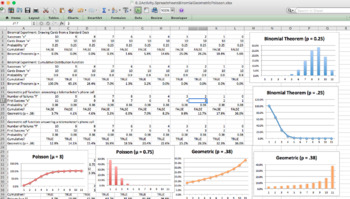
Statistics Spreadsheet Activity - Binomial, Geometric, Poisson (2 days)
Statistics Spreadsheet Activity - Binomial, Geometric, Poisson (2 days) This is a 1-2 day spreadsheet activity for a Statistics class. It uses spreadsheets as a walkthrough to allow students to explore the Binomial, Geometric, and Poisson distributions, as well as create graphs of the distributions. The product includes: 6.3 Spreadsheet Activity (Also included in " Statistics Unit 6 Bundle - Discrete Probability (12 days)" and in " A Mountain of Statistics Curriculum - One Full Year Bundle")Exce
Subjects:
Grades:
9th - 12th, Higher Education
Types:
CCSS:
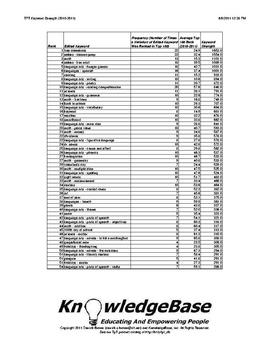
TPT KeyWord Strength Index (2010-2011) - Downloadable Spreadsheet!
What are the strongest keywords on TpT?
1. free downloads
2. Deanna Jump
3. math
Neither #1 nor #2 are surprises, but #3 (math) was certainly a surprise to me!
This report analyzes TpT's 2010-2011 keywords using a measure called "keyword strength".
The measure is based on a keyword's average rank, as well as the number of times it appeared in the 2010-2011 "Top 100" TpT search engine rankings.
This can be a valuable tool to help sellers understand TpT's marketplace supply and demand!
The P
Subjects:
Grades:
PreK - 12th, Higher Education, Adult Education, Staff
Hypothesis Testing Excel Calculator
Includes 1- and 2- Sample Hypothesis testing for means and proportions
Subjects:
Grades:
11th - 12th, Higher Education
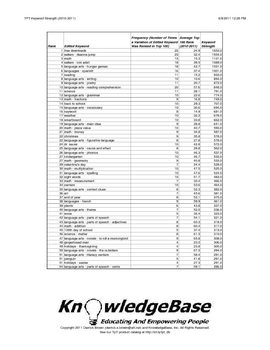
TPT KeyWord Strength Index (2010-2011) - Downloadable PDF!
What are the strongest keywords on TpT?
1. free downloads
2. Deanna Jump
3. math
Neither #1 nor #2 are surprises, but #3 (math) was certainly a surprise to me!
This report analyzes TpT's 2010-2011 keywords using a measure called "keyword strength".
The measure is based on a keyword's average rank, as well as the number of times it appeared in the 2010-2011 "Top 100" TpT search engine rankings.
This can be a valuable tool to help sellers understand TpT's marketplace supply and demand!
The P
Subjects:
Grades:
PreK - 12th, Higher Education, Adult Education, Staff
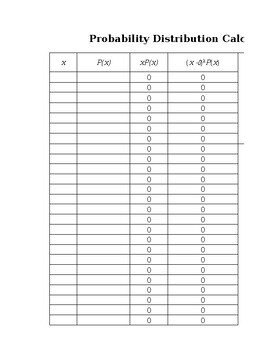
Probability Distribution Excel Calculators
Compute Binomial, Poisson, and Normal Probabilities
Subjects:
Grades:
11th - 12th, Higher Education
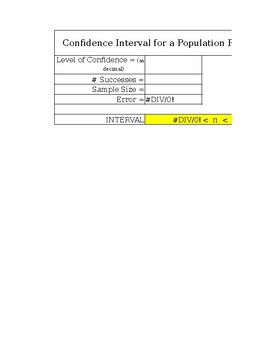
Confidence Interval Excel Calculator
Confidence Intervals for means, proportions, and variances
Subjects:
Grades:
11th - 12th, Higher Education
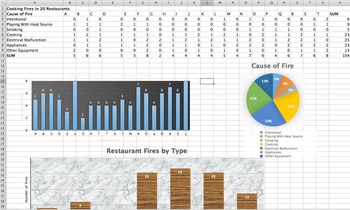
Statistics Project Unit 3 Spreadsheets Mean Median Mode Std. Deviation (2 day)
This is a 1-2 day project aimed at introducing a statistics class to Excel (or Numbers) who are familiar with Pie Charts, Bar Charts, Measures of Central Tendency, and Standard Deviation. The students will input data (included) into Excel (on fires in restaurants), form their own Bar Charts and Pie Charts, and be able to input formulas into the Excel to automatically calculate statistics. Students will be given the opportunity to explore different charts and design their charts to make them colo
Subjects:
Grades:
9th - 12th, Higher Education, Adult Education
Graphs, Charts, and Tables: U.S. Census Data Study
This lesson uses data from the 2010 U.S. Census to allow students to access numbers and data in a social science classroom. The lesson is a 2 day mini-unit centered on working with charts, graphs, and tables (serves extremely well for SAT and ACT prep). This cross-curricular lesson draws meaningful parallels between math and social science, and the necessity of bringing these subjects together. The lesson uses a comparative look at Census data for California and the United States as a whole, but
Subjects:
Grades:
8th - 12th, Higher Education
Types:
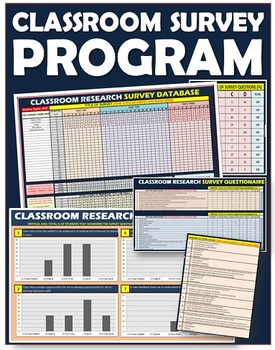
Surveys: Classroom All-IN-ONE Research Program
Empower Your Teaching with Data: Enhance Your Classroom with Powerful Survey Analysis!Elevate your teaching practice by leveraging the power of data with this user-friendly survey analysis program.Here's what sets it apart:Effortless Data Visualization: Transform survey responses into clear and visually appealing charts and graphs.Actionable Insights: Gain valuable insights into student learning styles, preferences, and areas for improvement.Informed Decisions: Make data-driven decisions to enha
Subjects:
Grades:
PreK - 12th, Higher Education, Adult Education, Staff
Types:
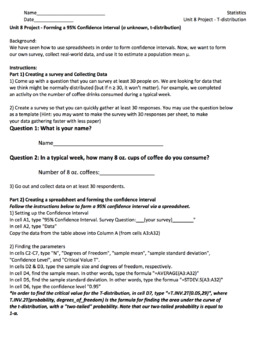
Statistics Unit 8 Project - Surveys, Confidence Intervals, Spreadsheets (3 days)
This is an end-of-unit project with Confidence Intervals for a Statistics class. Students will work together to create a survey, gather real-world data, create a spreadsheet, perform a confidence interval analysis to estimate the population mean μ, and create a Powerpoint presentation to present to class. The Product includes: Instructions for studentsTeacher instructions Excel spreadsheet with samplesGrading Rubric *The topics covered are Confidence Intervals, T-distribution, spreadsheets, pres
Subjects:
Grades:
10th - 12th, Higher Education
Types:
CCSS:
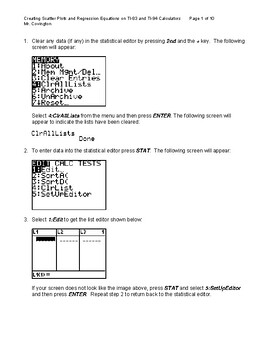
Creating Scatter Plots and Lines of best fit on TI-83/84 Graphing Calculator
A tutorial and reference guide for working with two-variable data to generate scatter plots and least squares method line of best fit on TI-83/84 graphing calculators and Microsoft Excel.
Subjects:
Grades:
8th - 12th, Higher Education, Adult Education
Types:
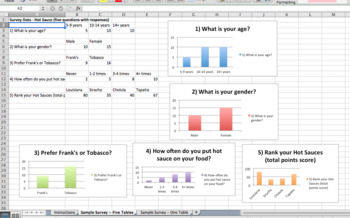
Statistics Unit 1 Project - Gathering Data (3 days)
This is an end-of-unit project for a Statistics class. It is introductory into survey methods, gathering data, using spreadsheets to organize data, creating charts, and presenting findings to the class. The Product includes: Instructions for studentsTeacher instructions for guidance on use and editingExcel spreadsheet with samplesGrading Rubric *The topics covered are survey methods - simple random, stratified, convenience, cluster, systematic - spreadsheets, charts, and presentations. The docum
Subjects:
Grades:
10th - 12th, Higher Education
Types:
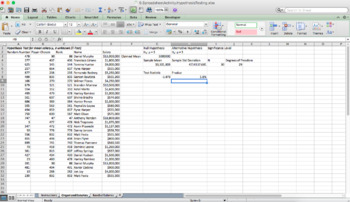
Statistics Unit 9 Spreadsheet Activity - Hypothesis Testing, VLOOKUP, T-Test
This is a 2 day spreadsheet activity for a Statistics class. It uses spreadsheets as a walkthrough to allow students to organize data, form a hypothesis, find the T-statistic and p-value and use the decision criterion. The activity uses VLOOKUP, RANDBETWEEN, AVERAGE, STDEV.S, ABS, SQRT, and TDIST built-in spreadsheet functions. The product includes: Unit 9 Spreadsheet Activity (in xlsx format)Teacher instructionsAnswer Key included. *The topics covered are Hypothesis Testing, One Sample T-Test,
Subjects:
Grades:
10th - 12th, Higher Education
Types:
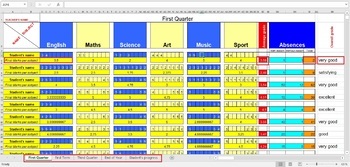
Calculate Student's Final Marks ( Grades ) in excel
If you want to easily calculate student's marks this excel document is great solution. I added all excel's necesarily formulas to make this important task so easier.When you add the marks for every subject, it's final mark will be automatically calculated. At the same time average grade will also be calculated and updated.There is also section for absences (excused and unexcused) which will also be calculated.At the end, if student's Overall grade is equal or above 4.5, it will be automaticaly w
Subjects:
Grades:
PreK - 12th, Higher Education, Adult Education, Staff
Types:
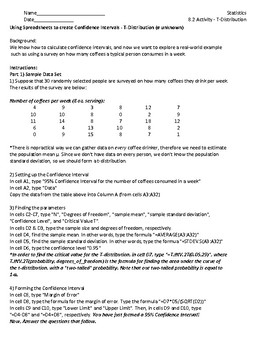
Statistics Unit 8.2 Spreadsheet Activity - Confidence Intervals, T-distribution
This is a 1 day spreadsheet activity for a Statistics class. It uses spreadsheets as a walkthrough to allow students to explore the T-distribution, and form a 95% confidence interval from a data set. The product includes: 8.2 Spreadsheet Activity (in xlsx format)Teacher instructionsAnswer Key included. *The topics covered are Confidence Intervals (σ unknown), T-distribution, "AVERAGE", "STDEV.S", and "T.INV.2T" functions. The documents are Excel based, pdfs included, and completely editable. En
Subjects:
Grades:
10th - 12th, Higher Education

Homeostasis Heart Rate Lab
This lab can be used for middle school sciences, any Biology-based science class, or mathematics statistics classes. Included are a word document with instructions, lab, an excel spreadsheet with example data, a blank sheet with formulas that will calculate data, and a PowerPoint with student instructions.
Subjects:
Grades:
6th - 12th, Higher Education
Types:
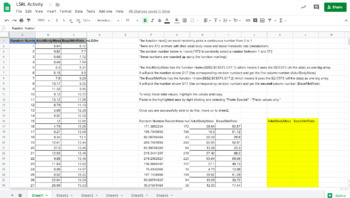
AP Statistics LSRL Transformations and Inference Activity with Excel
This activity guides students to use excel/ google sheets to1. Randomly select from a data set2. Transform the data into a power model3. Graph scatterplots and histograms of the data and residual plots4. Use XLMiner ToolPak to identify key statistics in the regression analysis5. Identify and interpret R, R^2, S, b0, b1, SEb16. Construct a confidence interval7. Identify the t-value and p-value for hypothesis testsThis file was originally created as a google sheet.A sample answer key is included.T
Subjects:
Grades:
12th, Higher Education
Types:

Stock Market Simulation
This product has a full lesson on how to teach students about the stock market. This allows them to actively work with different stocks to find out how stocks can shift and change over time. It can be adapted as a 9 weeks, semester, or even full year project.Included is an introductory PowerPoint, a sample Excel spreadsheet, a handout of the project instructions and a list of tips that I've learned using this that will help you out. This project was originally designed with an Economics class in
Subjects:
Grades:
6th - 12th, Higher Education, Adult Education
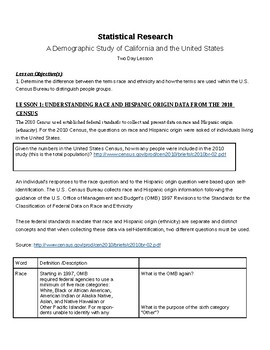
Statistical Analysis: U.S. Census Data Overview
This lesson uses data from the 2010 U.S. Census to allow students to access numbers and data in a social science classroom. The lesson is a 2 day mini-unit centered on working with charts, graphs, and tables (serves extremely well for SAT and ACT prep). This cross-curricular lesson draws meaningful parallels between math and social science, and the necessity of bringing these subjects together. The lesson uses a comparative look at Census data for California and the United States as a whole, but
Subjects:
Grades:
9th - 12th, Higher Education
Types:
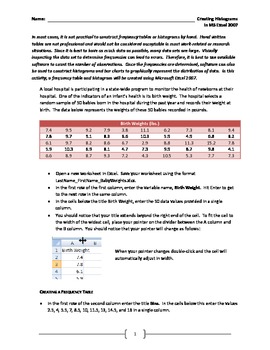
Creating Frequency Tables and Histograms in MS Excel 2007
This activity looks at a realistic data set and walks the student through constructing a frequency table and histogram using Microsoft Excel. It should be noted that Excel is not the best software package for creating histograms, but because it one of, it not the most widely used software package for data storage and presentation in business, it is important to know how to create professional-looking and statistically accurate graphics using this tool.
There are two different ways to constru
Subjects:
Grades:
11th - 12th, Higher Education
Types:
Showing 1-24 of 33 results


