75 results
2nd grade statistics resources for Microsoft Word
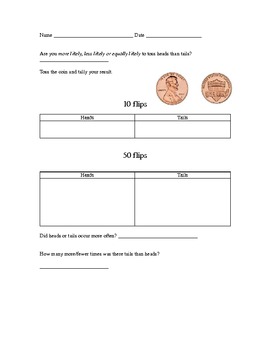
Probability: coin toss and dice roll
Teach probability using a penny and/or a dice. Introduce this probability game using key vocabulary: more likely, less likely or equally likely. Students will be able to practice using tally marks during the recording process.
Students will toss a penny 10 or 50 times and record the number of times heads or tails lands facing up. Students will roll a dice 10 or 50 times and record the number of times a even or odd number lands facing up.
Subjects:
Grades:
K - 4th
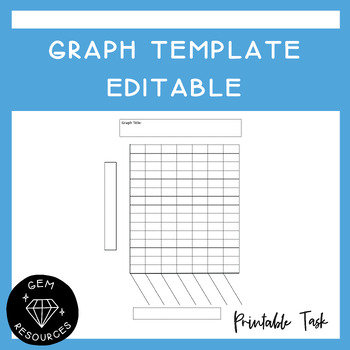
Graph Template Data and Statistics Maths Histogram Bar Column Drawing Editable
Students can use this to help them draw up a graph. It allows them to be accurate and has boxes for the titles needed for the graph.This Word document is editable.
Subjects:
Grades:
2nd - 6th
Types:
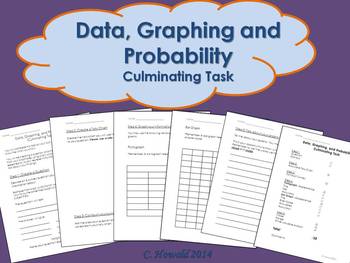
Graphing Unit Culminating Project
I used this activity as a summative assessment for my Data, Graphing and Probability Unit. This gave students the opportunity to create their own question, survey a group of students (visited another class in the school), collect, display and analyze their data.
I have left this as a .doc file so that you are able to adjust it to fit the needs of your classroom.
If you have any questions or concerns, let me know!
Thanks for downloading. Please take the time to rate this product.
If you e
Subjects:
Grades:
2nd - 4th
Types:
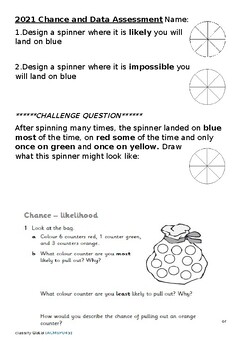
Chance and Data Test Assessment ACARA Year 2 Australia
This is a test that I use with my Year 2 Australian students to assess the ACARA outcomes for the strand Statistics and Probability, Chance and Data. It is a WORD doc, so fully editable. My tests allow for the 5 point scale, so often have harder questions or sums to allow for the higher marks. Students are told these harder questions are optional.The ACARA outcomes are: Identify practical activities and everyday events that involve chance. Describe outcomes as ‘likely’ or ‘unlikely’ and identify
Subjects:
Grades:
2nd
Types:
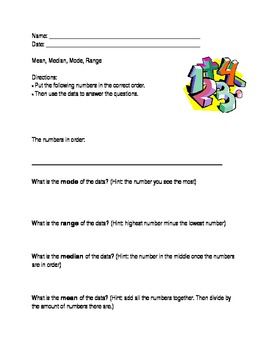
Mean, Median, Mode, Range; Modified Special Ed Math Template; Statistics
This is a modified worksheet from the middle school statistics curriculum. It is excellent for special education students who require an alternate or modified curriculum.
This worksheet allows teachers to input numbers in the blank space. This way teachers can use the template over and over with different numbers. Students are then to write the numbers in the correct order. Then, they have to find the mean, median, range, and mode. There are "hints" (formulas) that help the students differentia
Grades:
PreK - 12th
Types:
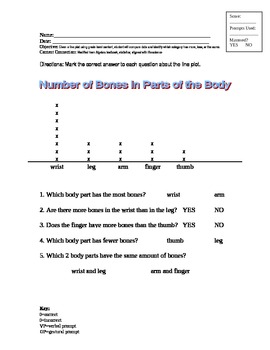
Reading a Line Plot; Modified Curriculum for Special Ed, Statistics
This line plot is modified from the middle school statistics curriculum. It is excellent for special education students who require an alternate or modified curriculum. The line plot is related to life science, and shows how many bones are in five different parts of the body. The questions on the worksheet ask questions about more and less. The answers are offered in a field of two.
This worksheet aligns with Maryland content standard:
Given a line plot using grade level content, student will c
Subjects:
Grades:
PreK - 5th
Types:
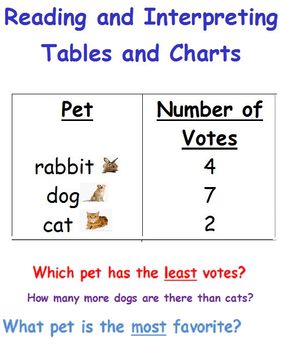
Reading a Table-Data and Statistics-First Grade
There are 4 different worksheets in which students can interpret the data of various tables. I hope they are of help to you! :)
Subjects:
Grades:
K - 3rd
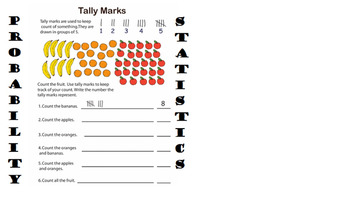
2nd grade 3day unit lesson plan: Probability and Statistics
2.17 The student will use data from experiments to construct picture graphs, pictographs, and bar graphs.
2.18 The student will use data from experiments to predict outcomes when the experiment is repeated.
2.19 The student will analyze data displayed in picture graphs, pictographs, and bar graphs.
Subjects:
Grades:
2nd
Types:
CCSS:
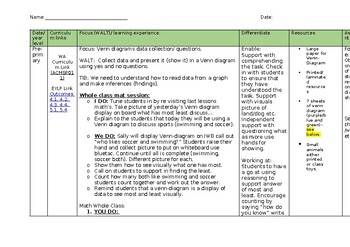
Venn Diagram lesson plan and resources
Lesson plan for teaching students how to use a Venn Diagram Pintables included for whole class and independent learning
Subjects:
Grades:
PreK - 6th
Types:
CCSS:
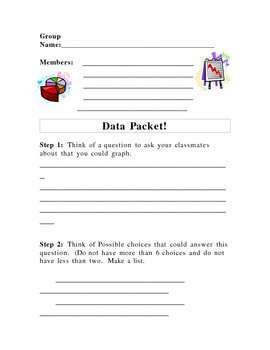
Circle Graph Project
This is a project for pairs or teams of students. They choose a question to graph by coming up with up to 6 possible responses. Then they ask their classmates and turn their answers into a circle graph.
Subjects:
Grades:
2nd - 6th
Types:

VicVELs Child Friendly Stats and Probability Footsteps Foundation to 6
Student friendly lists of VicVELs achievement standards for Statistics and Probability for Foundation to Level 6. These achievement standards are presented in a fun way for students and translated into child friendly language. Standards have also been broken into individual statements.
Subjects:
Grades:
PreK - 6th
Types:
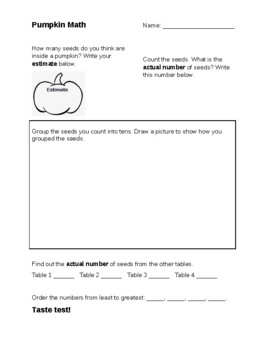
Pumpkin Math Activities
Pumpkin Math Lesson PlanIn this lesson, students will work in small groups with pumpkins in a variety of ways (scooping seeds, counting seeds, completing a taste test of cooked pumpkin seeds, and collecting and graphing data). It is an engaging way to help students meet a number of outcomes in Math and science. The worksheets attached to this lesson are editable to meet the needs of your classroom (e.g. number of pumpkins/tables in your room). They also provide a single place to record all of th
Subjects:
Grades:
1st - 5th
Types:
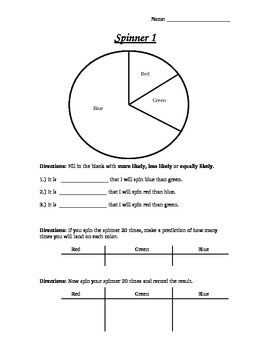
Probability Spinner Worksheets
Students color their own spinners and test out theories and predictions. There are three different activities in the pack. The lines and spinners do not line up correctly on preview but do on the document.
Subjects:
Grades:
2nd - 3rd
Types:
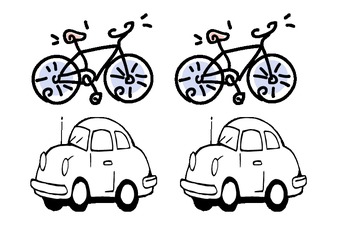
Picture Graph Pics - How the class travels to school
This is just a 4 page resource of pictures I used to introduce picture graphs to my year 1's.
There are four different pics - A bus, a car, a bike and someone walking.
I told the students that we were going to make a picture graph of how our class travels to school. We first made a tally table on the board and then students got the picture that matched their method of transport they take to school and got to colour it in. Once everyone had finished we made a big whole class picture graph.
A
Subjects:
Grades:
K - 2nd
Types:
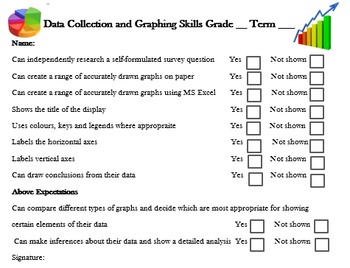
Graph and Data Assessment Checklist & Rubric
Short and quick-to-mark assessment rubric and checklist for graphing tasks suitable for students from grades 2 to 6.
You may also like:
-Comprehensive Multiplication Unit for free
- All Materials Maths units, just click on my store logo to view the full range.
Full set of Maths Assessments:
- Place Value Assessment
- Addition Assessment
- Subtraction Assessment
- Multiplication Assessment
- Division Assessment
- Fractions/Decimals Assessment
Subjects:
Grades:
2nd - 6th
Types:
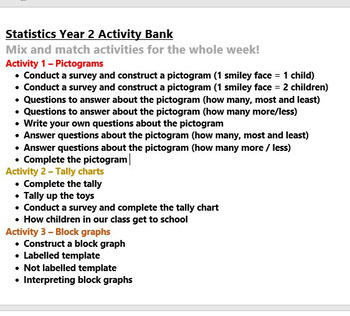
Statistics Pictograms Charts Graphs Year 2 Activity Bank (Differentiated)
19 statistics activities all in one place, mix and match them to teach the combination of skills suited for each of the ability groups in your class.
More than a week’s worth of Maths lessons without any hassle.
You can download Addition Year 2 Activity Bank for free to check the quality of my material.
Subjects:
Grades:
2nd
Types:
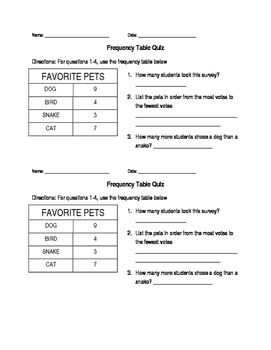
Math Frequency Table Quiz grades 1-3
This quiz is for students in grade 1, grade 2 and grade 3. The quiz has a frequency table on it and then it asks the students questions about the frequency table.
Subjects:
Grades:
1st - 3rd
Types:

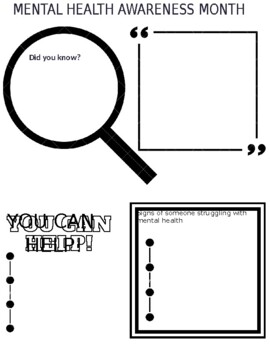
Mental Health Awareness Poster
A poster students can create to promote Mental Health Awareness around school. Fits perfectly with May Mental Health Awareness Month
Subjects:
Grades:
2nd - 12th, Staff
Types:
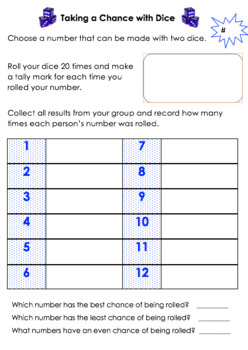
Taking a Chance with Dice
Students will work in a small group to play this simple dice game. Each group member selects a number from 2-12 and rolls the dice 20 times, recording a tally mark for each time their number is rolled. Student compare results and collate overall numbers rolled to find the chance of rolling numbers 2-12 with two die.
Subjects:
Grades:
1st - 4th
Types:
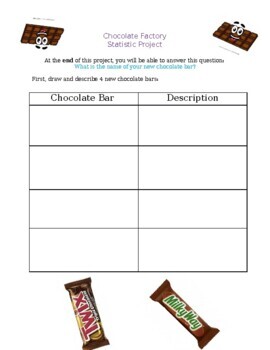
Chocolate Factory Statistics Project with Rubric
Chocolate Factory Statistics and Probability ProjectStudents are to come up with different chocolate bar designs and collect data on which is the most popular.At the end of the project, students can have a go at creating their chocolate bar packaging! Please see the store to see an additional, more comprehensive rubric.
Subjects:
Grades:
1st - 3rd
Types:
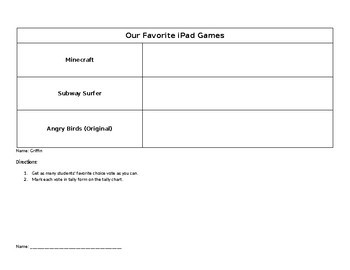
Tally Chart & Graph
My first graders loved doing this activity! Students get to pick their own category and choices then ask as many other students/people in the room as they can without double asking. Then they transfer their data to the the graph! This was a great, fun and engaging way to assess their learning during our data collection unit! Enjoy!
Subjects:
Grades:
1st - 2nd
Types:
CCSS:
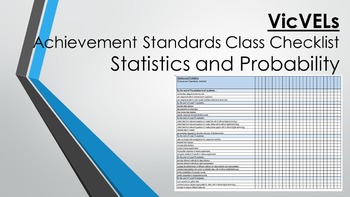
VicVELS Statistics and Probability Achievement Standards Class Checklist
VicVELs Achievement Standards for Statistics and Probability presented in a class checklist for primary levels, foundation to level 6. Great assessment tracker tool.
Subjects:
Grades:
PreK - 6th
Types:
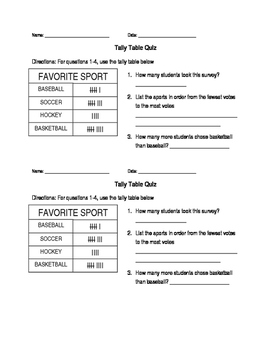
Math tally table quiz
This math tally table quiz can be used for 1st, 2nd or 3rd grade students. The quiz shows students a tally table and then asks them questions about the tally table.
Subjects:
Grades:
1st - 3rd
Types:
Showing 1-24 of 75 results


