379 results
12th grade Common Core HSS-ID.A.1 resources
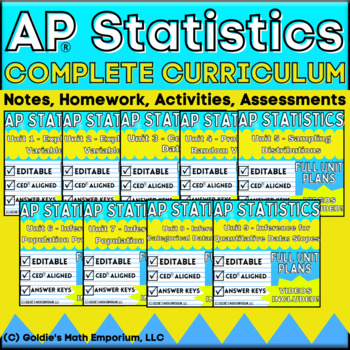
Goldie's FULL CURRICULUM for AP® Statistics
AP® Statistics Full CurriculumIn this product, you will receive all of Goldie's products related to AP® Statistics. All 9 units follow the College Board's© CED and include the following:Student Guided NotesStudent notes are "fill in the blank" style notes; teachers lead the lesson and work with students to complete the content. All content from the AP® CED is included and taught in the notes for this curriculum.Content VideosEach set of notes has a video to accompany it, where I teach the lesson
Subjects:
Grades:
10th - 12th
Types:
CCSS:
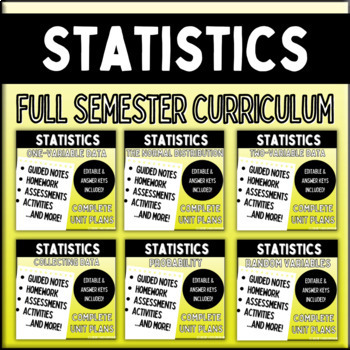
Statistics: FULL CURRICULUM BUNDLE
Statistics: Full Curriculum This is the FULL CURRICULUM bundle for my regular-level, Statistics course. If you are looking for my full curriculum for AP Statistics, follow the link here. This full curriculum is six units long and lasts 1 semester, approximately 90 school days. The following units are included in this bundle: Unit 1 – One-Variable DataUnit 2 – The Normal DistributionUnit 3 – Two-Variable DataUnit 4 – Collecting DataUnit 5 – ProbabilityUnit 6 – Random Variables Each unit contains
Subjects:
Grades:
11th - 12th
Types:
CCSS:

Box and Whisker Plots Whodunnit Activity - Printable & Digital Game Options
Nothing like a good criminal investigation to liven up box and whisker plots! Based off my popular CSI projects, I have created Whodunnits? The Whodunnits plan to focus on single content topics as opposed to units and will focus more on skill building than application. Every day can't be a project day, so Whodunnits can be an engaging out of their seat activity to practice important skills. In a Whodunnit?, students will work in teams to solve 10 practice problems that increase in difficult. Aft
Subjects:
Grades:
7th - 12th
Types:
CCSS:
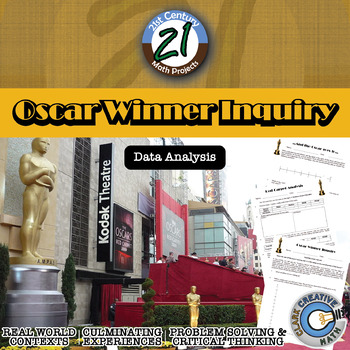
Oscar Winner -- Data Analysis & Statistics Inquiry - 21st Century Math Project
Utilize the last twenty years of Oscar winners as a data set to guide your students through creating box and whisker plots, histograms, and exploring mean, median, and mode -- in one 21st Century Math Project!Does the age of the award winning star in a film relate to the overall gross of the movie? Student will explore this inquiry question and use the data to support their conclusion.In this 8 page document you will be given a mapping to the Content Standards, an outline for how to implement t
Subjects:
Grades:
6th - 12th
Types:
Goldie’s AP® Statistics UNIT 1 PLANS – Exploring One Variable Data
AP® Statistics Unit 1 – Exploring One Variable DataUnit BundleThis unit contains everything you need to teach "Exploring One Variable Data" in AP® Statistics or regular-level Statistics. Students will go through how to represent quantitative and categorical data with various graphs and tables; find and interpret various measures of center and spread; and calculate and compare positions and percentiles in a normal distribution. This unit is part of my larger unit bundle: Goldie's AP® Statistics F
Subjects:
Grades:
10th - 12th
Types:
CCSS:
Also included in: Goldie's FULL CURRICULUM for AP® Statistics
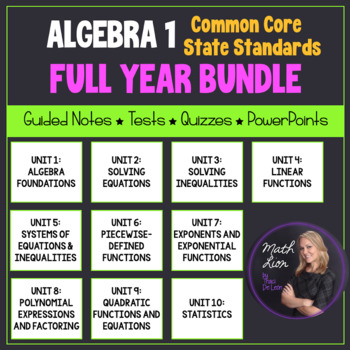
Algebra 1 Curriculum - Full Year EDITABLE Unit Plans | Bundled for Common Core
This is a great bundle that covers concepts for a full year Algebra 1 course! 76 lessons are included! Documents are EDITABLE!Included:- Overview of the common core alignment tandards (Two 18-week guides) (PDF and Word) - Overview of the common core alignment (PDF)- Guided notes for 76 lessons (PDF and Word)- PowerPoint presentations (aligned with guided notes) (PPTX)-10 Mid-unit quizzes (PDF and Word)-10 Unit tests (PDF and Word)-2 Semester exams (PDF and Word)Each lesson contains a learning
Grades:
8th - 12th
CCSS:
Statistics Project - Statistics Olympics
Engage your students in their study of statistics as they compete in self-created Olympic style events. This project will engage students and help them discover meaning and apply concepts including measures of central tendency, quartiles, outliers, variance, standard deviation, z-scores, box plots, histograms, normal and skewed distributions. This project can be completed in approximately 6-8 days (50-min class periods) ** March 2023 Update **Visual updates to all slides and documentsRubric ali
Subjects:
Grades:
6th - 12th
CCSS:
Math March Madness Full Tournament Project {BUNDLE}
Harness the excitement of NCAA March Madness with this huge project for secondary math teachers that follows all stages of the tournament! This Common Core aligned bundle comes with bonus parts not sold individually in my store so you can create a rich immersion in the tournament, practice probability and statistics and learn some interesting new ones along the way! Save $3 plus get bonus content by bundling!You can pick and choose which parts you would like to incorporate, or follow my schedu
Subjects:
Grades:
6th - 12th, Higher Education
Types:
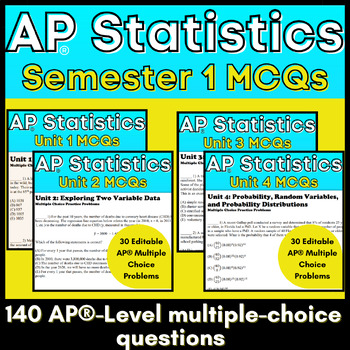
Goldie's AP® Statistics Semester 1 Multiple Choice Questions Bundle
AP® StatisticsSemester 1 (Units 1 - 4)Multiple Choice Questions (MCQ) Practice This is a resource that has 140 AP-level multiple-choice questions. You will receive the editable Word document for this resource, making it easy to modify and copy these questions in your classroom. You will also receive the PDF version for easy formatting. The answer key for this resource is included. These are BRAND NEW AP questions that I have developed for AP Statistics. These questions are not used anywhere else
Subjects:
Grades:
10th - 12th
Types:
CCSS:
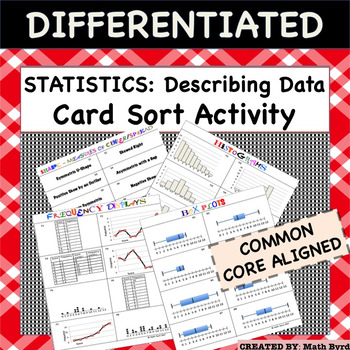
Statistics:Representing & Interpreting Data (Histogram, Box Plot, Dot Plot)
Complete Lesson! This lesson features a 40 CARD SORT, Differentiated Cornell Notes, Distribution Shapes Graphic Organizer, and Power Point to go with the notes! Perfect for the inclusive classroom! Within the Card Sort Activity there are 5 categories of cards to match: 1) Histogram2) Frequency Display (including Dot Plots, Frequency Line Graphs and Tables)3) Box Plots4) Describing Shape5) Describing Measures of Center & Spread. With 8 different sets of matches, there are 40 cards total. Stud
Subjects:
Grades:
8th - 12th
Types:
CCSS:
Also included in: Common Core Algebra 1 CARD SORT ACTIVITIES - BUNDLE PRICE!
![Preview of Statistics Final Exam and Review [AP, College, and Honors]](https://ecdn.teacherspayteachers.com/thumbitem/Statisticis-FinalReviewStudy-Guide-Exam-1711356723/original-699492-1.jpg)
Statistics Final Exam and Review [AP, College, and Honors]
You can use this Statistics Final Exam in an AP Statistics, Honors Statistics, or a College Statistics course as an assessment, review or both. What's Included?Included are 6 different versions, each including 60 well chosen representative questions in both multiple choice format and also in free response format*. These reviews and tests work well in class or as a take- home. The tests are editable with Adobe Acrobat Pro. Each test should take about 2 - 3 hours and can be taken with a graphin
Subjects:
Grades:
10th - 12th, Higher Education
Types:
CCSS:
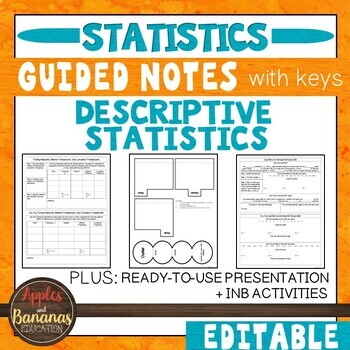
Descriptive Statistics- Guided Notes, Presentation, and INB Activities
This Introduction to Statistics product is flexible, editable, and can be used for in-person or distance learning. Take the time and stress out of creating your own guided notes and presentations. There are many ways to use this engaging bundle. It includes guided notes embedded with student practice problems (keys included), foldable activities, and a PowerPoint presentation for focused instruction. Choose what works best for your class/student and modify to make the content fit your needs. Not
Subjects:
Grades:
9th - 12th
CCSS:
Also included in: Custom Bundle for Viet
High School Data Analysis Project
This project covers a large range of data analysis methods. There are eleven total parts to the project.
Part One: the students have to collect data from 20 students outside of the classroom. Directions specify to ask students from each grade level.
Part Two: Measures of Center and Variation. Students will calculate mean, median, mode, range, and standard deviation for some of the data collected. Definitions of each term are included.
Part Three: Box-And-Whisker Plot. Students will create t
Subjects:
Grades:
9th - 12th
Types:
CCSS:
Home Prices: High School Statistics Project
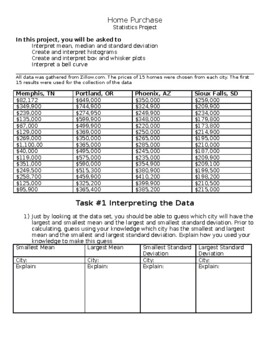
This statistics project has students exploring home prices and using their knowledge of mean, median, standard deviation, histograms, box and whisker plots, and bell curves to make predictions and inferences about the data. This project is provided in a word document to allow the teacher the ability to edit the document or load it to a google doc. In this project students first make predictions about measures of spread and central tendency without calculating but by looking at the data. Students
Subjects:
Grades:
9th - 12th
Types:
CCSS:
Constructing Box-and-Whisker Plots - Stations Activity
About This Resource:In this activity students will practice constructing box-and-whisker plots when provided a data set. Students will need to calculate the five number summary (minimum, first quartile, median, third quartile, and maximum) in order to be successful on this activity. The prep required by the teacher consists of printing the stations cards, making a copy of the graphic organizer for each student, and setting the expectations and instructions with their students.Your students will
Subjects:
Grades:
6th - 12th
Types:
CCSS:
Statistics: One Variable Data
StatisticsUnit 1: One Variable Data A complete unit bundle for a high school statistics course. Welcome! This is the complete unit plan for the first unit in my regular level Statistics class. (If you are interested in the AP Statistics Unit 1 Plans, check out my listing here.) Included in this resource: 9 complete sets of student guided notes (annotated answer keys included)9 homework problem sets + complete test review (annotated answer keys included)3 assessments – 2 quizzes and test (answer
Subjects:
Grades:
10th - 12th
Types:
CCSS:
Also included in: Statistics: FULL CURRICULUM BUNDLE
Statistics (Algebra 1 Curriculum - Unit 10) | Bundle for Common Core
This is a great unit that covers a Statistics unit in an Algebra 1 course! 9 lessons are included!All documents are EDITABLE!Included:- Overview of the common core alignment (PDF)- Guided notes for 9 lessons (PDF and Word)- PowerPoints that coordinate with the guided notes (PPTX)- Mid-Unit Quiz (PDF and Word)- Unit Test (PDF and Word)-Pacing Guide (PDF and Word)Each lesson contains a learning scale, warm up (do-now or bell ringer), key concepts, vocabulary, and examples for students to follow w
Subjects:
Grades:
7th - 12th
CCSS:

Standard Deviation Whodunnit Activity - Printable & Digital Game Options
Nothing like a good criminal investigation to liven up standard deviation! Based off my popular CSI projects, I have created Whodunnits? The Whodunnits plan to focus on single content topics as opposed to units and will focus more on skill building than application. Every day can't be a project day, so Whodunnits can be an engaging out of their seat activity to practice important skills. In a Whodunnit?, students will work in teams to solve 10 practice problems that increase in difficult. After
Subjects:
Grades:
7th - 12th
Types:
CCSS:
Also included in: Measures of Center & Variance Unit Bundle - Distance Learning Compatible
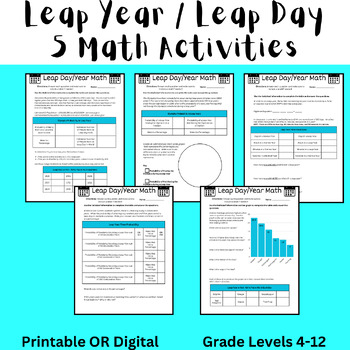
Leap Day (Leap Year) 2024 Math Activity (Algebra and Data) Digital or Printable
These 5 activities are fun NO PREP math activities to do to celebrate Leap Day 2024 (Leap Year 2024). The activities can be completed as 5 separate pages or as a 5 page packet. There is a customizable digital resource (Google Document) and a printable resource (Canva) that contain the same directions and activity. This was designed for students in middle school, but could be used for upper elementary and high school students in Pre Algebra, Pre-Algebra, or Algebra. In this assignment, students
Subjects:
Grades:
4th - 12th, Higher Education, Adult Education
Types:
Also included in: Leap Year (Leap Day) 2024 Bundle - Math, Reading, Writing, and Trivia
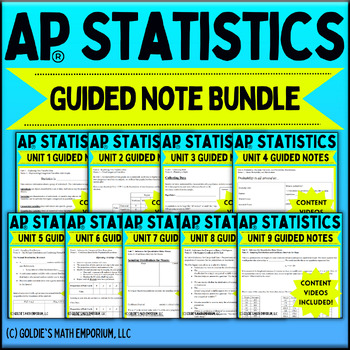
Goldie’s Guided Note Bundle for AP® Statistics
AP® StatisticsGuided Note BundleNote: If you have purchased individual Unit Plans or Goldie's FULL CURRICULUM for AP® Statistics, you already have these resources. You do NOT need to purchase this.Welcome! This is a bundle for all of my guided notes for all Units of AP Statistics. All of the resources are 100% editable, to modify to fit your classroom needs. The zip folder includes the Word document, which you have permission to edit completely. The PDF version and answer keys are included for y
Subjects:
Grades:
10th - 12th
Types:
CCSS:
High School Math Common Core Aligned IEP Goal Bank
This IEP goal bank was created to assist special education teachers with the task of writing standards-based IEP goals in math. After spending countless hours developing IEP goals myself and really having to think through how to best individualize goals and objectives for my own students, I wanted to share this resource to help other special education teachers gain back some of their time.This goal bank includes the following:An introduction and guide that explains how to use the document.Each s
Subjects:
Grades:
9th - 12th
CCSS:
AP Statistics
This AP Statistics curriculum bundle contains the following (please take time to preview video and/or individual item previews):Guided Notes and Graphic Organizers (EDITABLE)Exhibition stations (slides) with guided notes (EDITABLE)ActivitiesProjects (EDITABLE)Exams (EDITABLE)Teacher's pacing guide and suggested order for each unit Review in AP style for preparation for the APCOMING: powerpoint with guided notes for each of 9 units NEW! UNIT 1 and UNIT 2 slides and editable notes are currently in
Subjects:
Grades:
10th - 12th
CCSS:
Sports Statistics & Probability curriculum workbook (130+ pages) - Project-based
WATCH THE PREVIEW CLIP! E-MAIL ME FOR DISCOUNTS OR QUESTIONS AT MEDEIROSVINNY@YAHOO.COM.Looking to start an elective math class? Interested in project-based assessments?Tired of teaching statistics with no real-world application?This 132-page interactive workbook serves as a textbook for an introductory statistics math class; complete with Common Core standards crosswalk, embedded answers, and tons of activities and mini-projects. This workbook is the only resource I use for my 'Statistical R
Subjects:
Grades:
8th - 12th
Types:
CCSS:
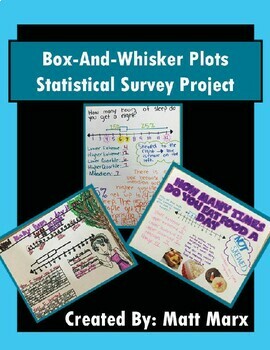
Box And Whisker Plots - Statistical Survey Project
Box-And-Whisker Plots - Statistical Survey ProjectThis Statistical Survey Project offers students the opportunity to demonstrate an understanding of Statistics content through the lens of a personalized statistical survey and the creation/study of a Box-And-Whisker Plot.Students insert themselves into their learning by selecting their own personalized survey question. Students have fun creating their posters, sharing them with the class, and having them displayed for all to see in the classroom.
Subjects:
Grades:
6th - 12th, Higher Education, Adult Education
Types:
CCSS:
Showing 1-24 of 379 results


