10 results
Not grade specific Common Core HSS-ID.A.1 resources
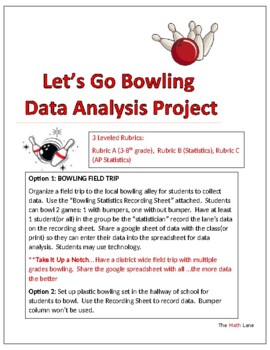
Let's Go Bowling Statistics STEM Project & Field Trip (3-12 and AP Stat)
Great END OF YEAR project. Get ready to strike up some fun with your students on a field trip to the bowling alley or right in your own hallway with a plastic bowling set! This isn't just any ordinary field trip - it's a real-world data collection extravaganza. 3 different leveled rubrics (Grade 4-10, Statistics, AP Statistics) so students can analyze the data based on their math knowledge. Students will be able to practice creating and analyzing graphical displays, scatterplots, construct c
Subjects:
Grades:
Not Grade Specific
Types:
Also included in: High School Statistics Project Bundle
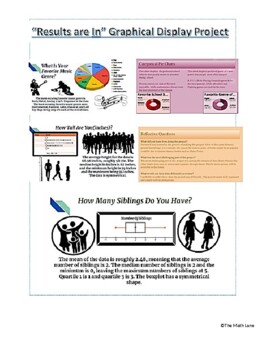
"The Results are In" Graphical Display Stats End of Year Project (All Grades)
Get ready to take your data analysis skills to the next level with our Graphical Display Project! Designed for students who want to create visually stunning displays of their data, this project allows you to not only collect data using Google Surveys, but also analyze and present it using Google Sheets. With detailed instructions, project examples, and a comprehensive rubric included, you'll have everything you need to create professional-looking graphical displays of both numerical and categori
Subjects:
Grades:
Not Grade Specific
Types:
CCSS:
Also included in: High School Math Projects (Algebra II and Statistics) STEM No prep
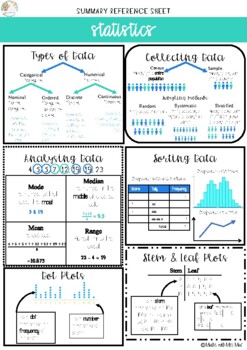
Summary Reference Sheet - Statistics
This product summarises key information when introducing statistics. Print and distribute to students to use as summary reference sheets while they work through the topic or display on your bulletin boards or classroom walls all year round. You and your students will find this simple yet informative cheat sheet easy to use!
Subjects:
Grades:
Not Grade Specific
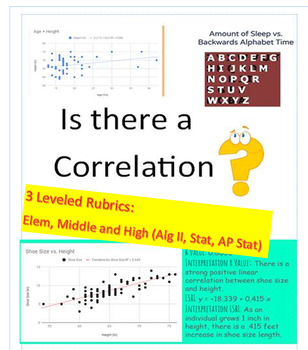
Correlation? Data Project (3 Rubrics_Elem/Middle School/ AP Stats) EOY
Get ready to supercharge your students' data analysis skills with this dynamic project! Perfect for end of year or semester project. In this engaging activity, students will have the exciting opportunity to collect their own data through surveys, online research, or real world data sets. They will then dive deep into the world of statistics as they determine if there is a correlation between two variables. With three different leveled rubrics, this project is perfect for students of all ages an
Subjects:
Grades:
Not Grade Specific
Types:
CCSS:
Also included in: High School Math Projects (Algebra II and Statistics) STEM No prep
The Data Driven Teacher
Your classroom is full of data points of which you can be made aware. The purpose of this book is to set out the methods by which you, a teacher practitioner, can collect, analyze, and use data in the context of a teaching and learning environment. It focuses on helping you develop tools to model classroom data from the following components of the classroom: student relationshipsclassroom disciplineclassroom discoursecurriculum developmentassessment of masteryThe methods this book presents to
Grades:
Not Grade Specific
Types:
CCSS:
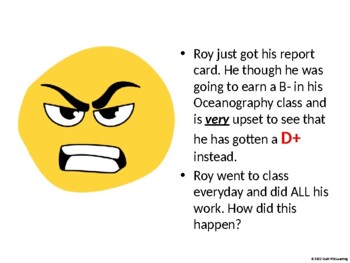
"Why Don't I Have an A???" Weighted Averages & Grade Calculation Activity
What's My Grade?! - Weighted AveragesDo your students constantly ask you "What's my grade" or "If I complete this assignment, what will my grade be"? This is a great presentation that can be used any time during the school year to help your students understand where their grade comes from and what a weighted average is. It is especially useful at the beginning of year to set grade expectations or at the end of the year to help students make sense of their grades. This presentation works with ALL
Grades:
Not Grade Specific
CCSS:

Teaching with Baseball Statistics
I use this activity to teach my science students how to model an idea using data. Students learn to predict the outcomes of a baseball pitcher based on their last 3 years of stats. Students learn to analyze their data and determine trends in the data. Students also learn to compare data from their pitcher to other students' pitchers (collaboration). Students also must be able to/learn to accurately graph their data. There is also a research component as students must research their pitcher's
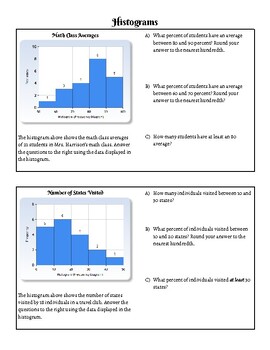
Histogram Practice Sheet
Aligned to the Algebra 1 NYS Next Gen Learning Standards- NY-6.SP4: Display quantitative data in plots on a number line, including dot plots, and histograms.This is a practice sheet to help students master histograms. Students will interpret the data from two histograms, and then construct their own histogram to represent a set of data. Designed to take about 20 minutes to complete
Subjects:
Grades:
Not Grade Specific
Types:
CCSS:
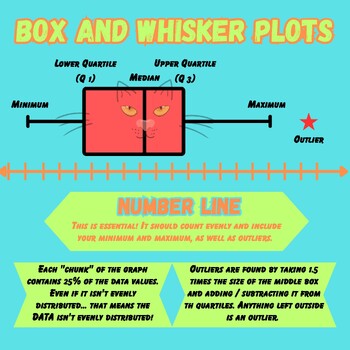
Box Plot Poster
Box plot poster showing where each number of the 5 number summary goes on a number line and describes how to find outliers using 1.5 IQR rule
Subjects:
Grades:
Not Grade Specific
Types:
CCSS:
Mean, Median, Mode, and Visualizing Real Data - Group Activities
These activities and handouts task groups of students to calculate the mean, median, mode, and range of real data, as well as plotting a box plot and a histogram, through 6 group activities that can take 1 to 3 hours, depending on the class. Solutions are provided where applicable (3 activities).Target Level of Math Class:Pre-algebra, arithmetic, introduction to statistics, data visualizationAccess to calculators.For completion in groups in person, with students actively sharing solutions with
Subjects:
Grades:
Not Grade Specific
Types:
Showing 1-10 of 10 results

