22 results
3rd grade graphing resources for Microsoft Publisher
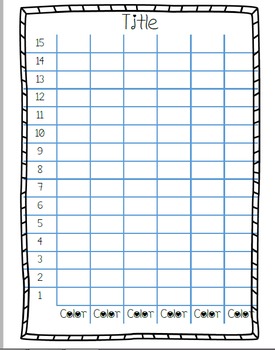
Blank Editable Graphs
These are blank graphs that you can edit by typing in the name of the graph and whatever objects are being graphed. There are bar graphs, a pie graph, and a line graph template.
Subjects:
Grades:
K - 3rd
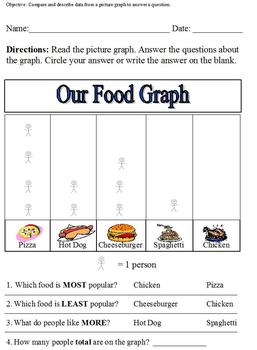
Food Picture Graph; Compare and Describe Data in a Graph
This is modified for sixth grade special ed, statistics. Students will read the graph and answer the questions. This can also be used in primary grades.
Subjects:
Grades:
1st - 6th
Types:
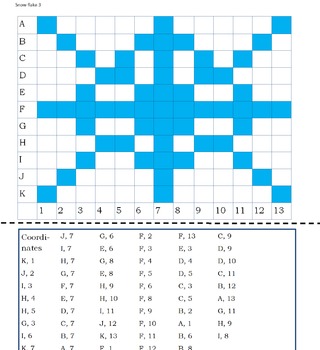
Snowflake Graphing- 4 styles
Snowflake graphing with four styles of snow flakes and three sizes graphs for each. Document made in Microsoft Publisher. Graphs can be sized to own needs/preferences. Each snowflake has an "answer" provided as well. Students can complete the graph using manipulatives (sequins, rhinestones/gems, pony beads, hole punch snowflake, hole punch circles, etc.) glued into given coordinates. Students can also color in the blocks with various colors to form the snowflake using the coordinates. Addi
Subjects:
Grades:
K - 5th
Types:
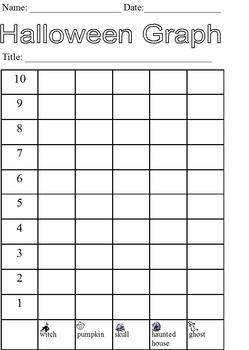
Halloween Graphing With Pictures; Cut and Paste Activity; modified curriculum
This is a three-page activity. The fourth page is all of the pictures that the students will be given by their teacher. These can be cut out individually ahead of time or students can be given a chunk of pictures that they need to cut out. Students should each get 15 pictures to graph.
The first page includes directions:
"Your teacher will give you 15 Halloween pictures to graph. Sort your pictures to put each of the same picture in one pile. Answer the questions on the worksheets and then glu
Subjects:
Grades:
PreK - 12th
Types:
Fruit Loop Math
Here are three worksheets that you can use to graph Fruit Loops! My students loved it and they get a snack at the end:) I hope you enjoy it as well!
Grades:
1st - 3rd
Types:
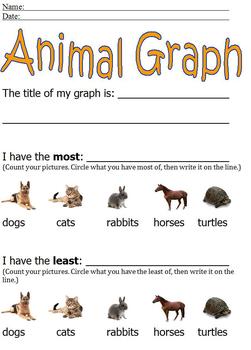
Animal Graphing With Pictures; Simple Cut & Paste; more/less modified curriculum
*****This is the same animal graphing activity found in the animal math packet*****
This is a four-page activity. The third page is all of the pictures that the students will be given by their teacher. These can be cut out individually ahead of time or students can be given a chunk of pictures that they need to cut out. Students should each get 10-15 pictures to graph.
The first page requires students to title their graph, count the pictures to identify most and least, and write in the correc
Subjects:
Grades:
PreK - 12th
Types:
The Country Mouse and the City Mouse Find and Graph
This is a fun math project to pair with the book The Country Mouse and the City Mouse! The math project is finding things related to the book and graphing how many of each is found. This can be used with a Math lesson or as a fun "filler" project!
Grades:
PreK - 3rd
Types:
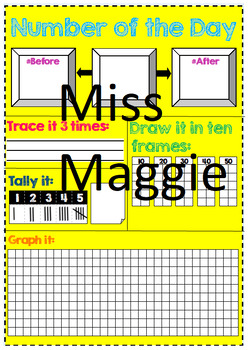
Number of the Day
This is something I use every single day in my classroom so I had to share! Please try it once and you´ll love it. Every day you pick a number and ask your students to pass in front of the class to fill in the blanks.
This poster was created in Publisher for you to print it in a big size!
Grades:
PreK - 4th
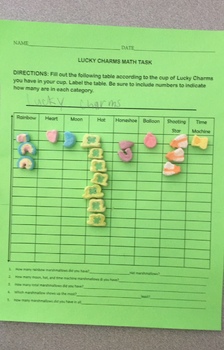
March St. Patrick's Day Math Task Lucky Charms
By using cereal, this math task allows for students to create their own graph,demonstrate most/least, and adding many numbers. Students can do this in groups or individually in a math center. My students love math tasks every Friday.
Subjects:
Grades:
K - 3rd
Types:
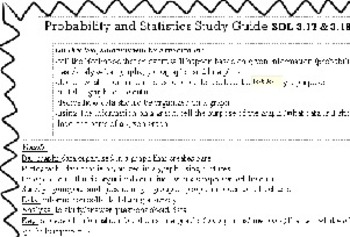
Graphing & Probability Study Guide
This is a study guide that I recently gave my students to help them study for their unit test on graphs and probability. This study guide gives the definitions of: bar graph, pictograph, line plot, survey, data, analyze, key, and probability. Then it has sample problems dealing with the 3 graphs (line plot, picto, and bar) and a few dealing with probability (certain, likely, unlikely, as likely as/equally likely, and impossible).
I have left the study guide in the publisher format in case you w
Subjects:
Grades:
1st - 5th
Types:

Line Plot Cards
Students use these cards to practice answering questions about line plots. Students could use these cards to play a board game or just for practice.
Grades:
2nd - 5th
Types:
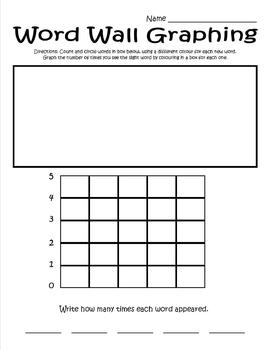
Word Wall Graphing
A fun way to incorportate your ELA with Math. Put 5 words from your word wall in the box, 1-5 times. The kids will then count the number of times a word appears and graph it.

Graphing Vocabulary
This file is in Microsoft Publisher. The teachers in my building make this page into poster-size to hang in their classroom.
Subjects:
Grades:
1st - 3rd
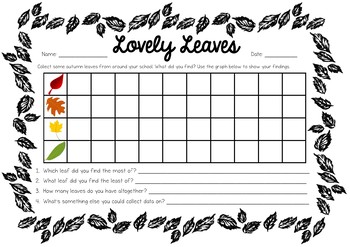
Statistics and Probability Worksheet
Make the most of the beautiful autumn leaves with you class!
Head outdoors and go for a forage for different coloured leaves. Children then sort their leaves into 4 groups (by colour red, orange, yellow and green). Students record what they found on the worksheet provided.
FULLY EDITABLE
Subjects:
Grades:
K - 3rd
Types:

Pictograph Introduction Classwork
Use this worksheet paper right after you teach your introduction or review lesson on pictographs. Students need to know how to draw objects using a key and making halves. Students also answer questions about the data.
Grades:
2nd - 4th
Types:
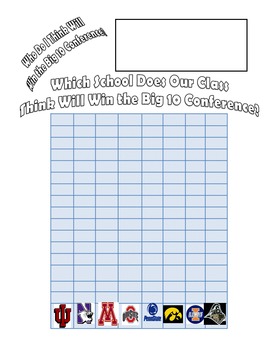
March Madness Graph
Have your students vote on which Big 10 university they think will win the Big 10 conference. Graph the totals together as a group. Then have students draw the name or emblem of the school the chose n the box on the top.
Subjects:
Grades:
3rd - 7th

Plan A Vacation in Indiana
This project can be adapted to meet the social studies standards of other states, but is created for the state of Indiana. Students choose a vacation destination as well as two historical stops in Indiana. They plan their trip using many resources including brochures, mapquest, their text book, and more! This project incorporates social studies, health, math, reading, and writing standards! The final product will be a scrapbook created by each student that hightlights the important parts of In
Subjects:
Grades:
3rd - 5th
Types:
Maths Grids - 5x5 Grids - 6 on a page
Grids that can be used for many different mathematical applications - Matrices, Data Collection, Mapping, Instruction Following.
Subjects:
Grades:
1st - 12th
Types:

Weather graph for journals
This is a weekly weather graph and fill in the blank for the students to fill out each week. I attach these in my students math/ science journals and they fill them out at the beginning of each morning.
Subjects:
Grades:
PreK - 3rd
Types:

Journal Weather graph
This is a weekly weather graph and fill in the blank for the students to fill out each week. I attach these in my students math/ science journals and they fill them out at the beginning of each morning.
Subjects:
Grades:
PreK - 3rd
Types:

Frequency Table Activity
Easy frequency table dice activity that I created for my 3rd graders. They loved it!
Subjects:
Grades:
2nd - 4th
Types:
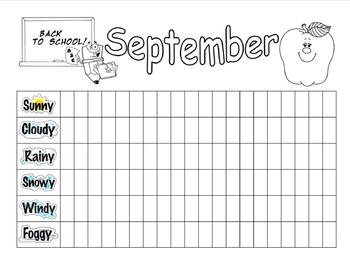
Weather Graph - September
September Weather Graph - sunny, cloudy, rainy, snowy, windy, foggy.
Publisher file can be changed to use for any month of the year.
Subjects:
Grades:
PreK - 3rd
Types:
Showing 1-22 of 22 results


