17 results
Preschool graphing resources for Microsoft Publisher
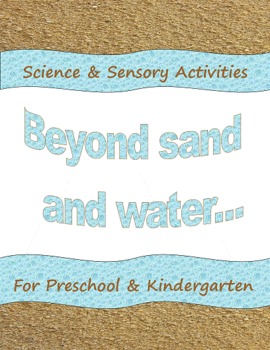
Beyond Sand & Water: Sensory and Science Activities for Preschool & Kindergarten
This package is packed with 8 pages of fun sensory and science activities and recipes that are great for Preschool and Kindergarten classrooms. First and second graders would be fascinated by many of these activities as well. Included are some learning extensions and twists on some more classic recipes and experiments. Many of these are great to take outside as well. Several of the activities are fun for all ages!!
Subjects:
Grades:
PreK - 1st
Types:
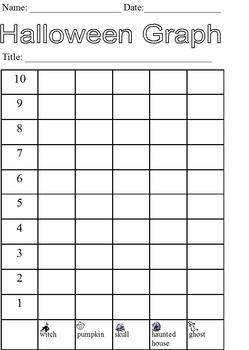
Halloween Graphing With Pictures; Cut and Paste Activity; modified curriculum
This is a three-page activity. The fourth page is all of the pictures that the students will be given by their teacher. These can be cut out individually ahead of time or students can be given a chunk of pictures that they need to cut out. Students should each get 15 pictures to graph.
The first page includes directions:
"Your teacher will give you 15 Halloween pictures to graph. Sort your pictures to put each of the same picture in one pile. Answer the questions on the worksheets and then glu
Subjects:
Grades:
PreK - 12th
Types:
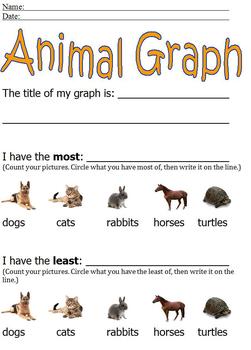
Animal Graphing With Pictures; Simple Cut & Paste; more/less modified curriculum
*****This is the same animal graphing activity found in the animal math packet*****
This is a four-page activity. The third page is all of the pictures that the students will be given by their teacher. These can be cut out individually ahead of time or students can be given a chunk of pictures that they need to cut out. Students should each get 10-15 pictures to graph.
The first page requires students to title their graph, count the pictures to identify most and least, and write in the correc
Subjects:
Grades:
PreK - 12th
Types:
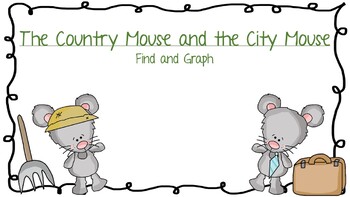
The Country Mouse and the City Mouse Find and Graph
This is a fun math project to pair with the book The Country Mouse and the City Mouse! The math project is finding things related to the book and graphing how many of each is found. This can be used with a Math lesson or as a fun "filler" project!
Grades:
PreK - 3rd
Types:
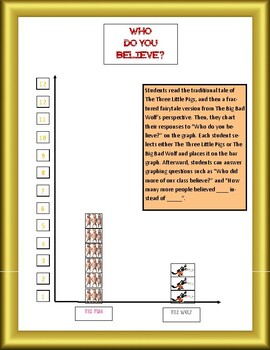
Fractured Fairytale Graphing: Three Little Pigs vs. The Big Bad Wolf
Engage your students in an interactive STEM activity, graphing their opinions on who told the truth, The Three Little Pigs or The Big Bad Wolf!Included: Title QuestionNumbers for measuring each categoryCategory Labels - The Pigs/The WolfThree Little Pigs graphing cardsBig Bad Wolf graphing cardsI would recommend using any copy of The Three Little Pigs traditional tale and either "The True Story of The Three Little Pigs" by Jon Scieszka and Lane Smith or "No Lie, Pigs (And Their Houses) Can Fly!
Subjects:
Grades:
PreK - 2nd
Types:
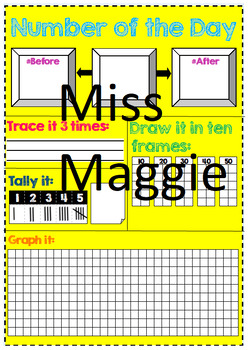
Number of the Day
This is something I use every single day in my classroom so I had to share! Please try it once and you´ll love it. Every day you pick a number and ask your students to pass in front of the class to fill in the blanks.
This poster was created in Publisher for you to print it in a big size!
Grades:
PreK - 4th
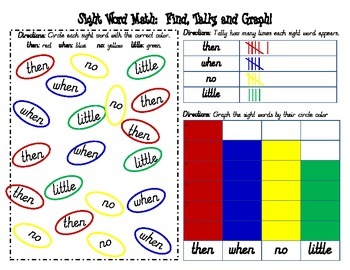
Sight Word Math Activity
This sight word math activity allows learning across curriculum. Students will get practice with identifying sight words as well as math concepts (graphing and tally marks). This document can be edited to fit your personal sight word list. My class uses this document weekly, with the words and the colors being changed to keep my kiddos on their toes!
Grades:
PreK - 1st
Types:
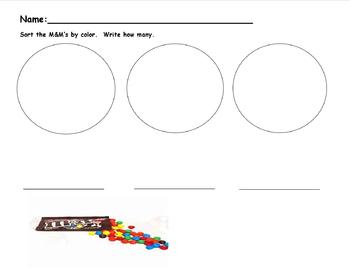
Sorting M&M's by Color
Simple sheet for students to practice sorting M&M's by color and record the correct amount of each group. Perfect for Centers. Easy to use and understand directions.
Subjects:
Grades:
PreK - 1st
Types:
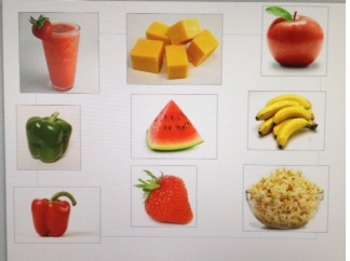
Healthy Food Clip Art
Clip Art of many types of healthy food great for sorting and graphing.
Subjects:
Grades:
PreK - 1st
Types:
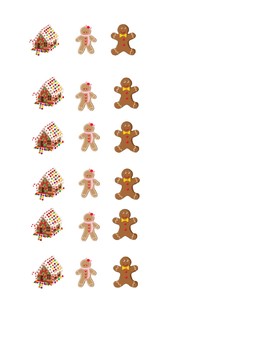
Gingerbread Roll the Cube Math Center
Children have a great time rolling the cube and marking the graph to show what was rolled. They continue doing this until one reaches the top. Throughout they can ask a buddy "What has the most so far?" or "How many more does ____ have than ____?"
Grades:
PreK - 2nd
Types:
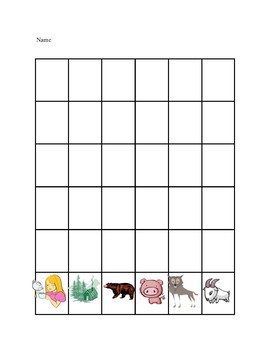
Fairy Tale Roll The Cube
Cut out the pictures on the second page. Tape them on wooden cubes. Students will roll the cube and mark the appropriate box in the graph. They continue until one reaches the top. Students can periodically stop to ask a friend questions like "What has the most so far?" or "How many more does ____ have than ____?"
Subjects:
Grades:
PreK - 2nd
Types:
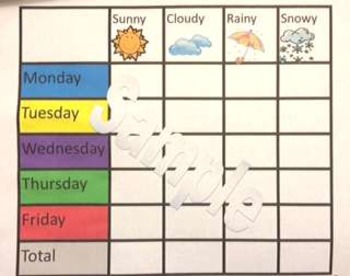
simple weather graph
This is a simple weather graph/chart the has the days for the school week Monday-Friday and a place to record the weather (sunny, cloudy, rainy, or snowy) for each day. There is also a row to record the totals for each type of weather for the week. It can be printed as a worksheet or projected on a whiteboard for morning circle/meeting time. There are circles that can be dragged to record the weather on the chart if projecting.
Subjects:
Grades:
PreK - 2nd
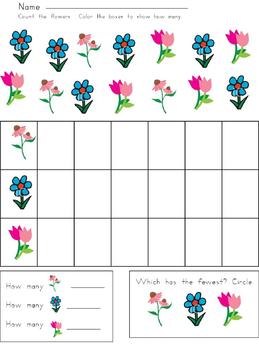
Flowers Graphing Practice Sheet
This is graphing sheet using flower clip art that can be used for center or job work during math time.
Subjects:
Grades:
PreK - 1st
Types:

Weather graph for journals
This is a weekly weather graph and fill in the blank for the students to fill out each week. I attach these in my students math/ science journals and they fill them out at the beginning of each morning.
Subjects:
Grades:
PreK - 3rd
Types:

Journal Weather graph
This is a weekly weather graph and fill in the blank for the students to fill out each week. I attach these in my students math/ science journals and they fill them out at the beginning of each morning.
Subjects:
Grades:
PreK - 3rd
Types:
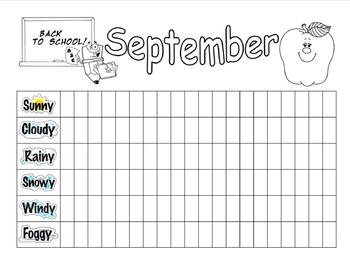
Weather Graph - September
September Weather Graph - sunny, cloudy, rainy, snowy, windy, foggy.
Publisher file can be changed to use for any month of the year.
Subjects:
Grades:
PreK - 3rd
Types:
Showing 1-17 of 17 results


