9 results
8th grade graphing resources for Microsoft Publisher
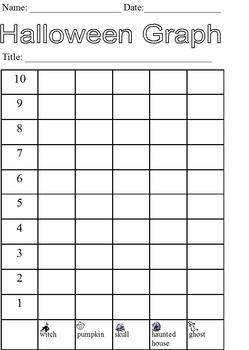
Halloween Graphing With Pictures; Cut and Paste Activity; modified curriculum
This is a three-page activity. The fourth page is all of the pictures that the students will be given by their teacher. These can be cut out individually ahead of time or students can be given a chunk of pictures that they need to cut out. Students should each get 15 pictures to graph.
The first page includes directions:
"Your teacher will give you 15 Halloween pictures to graph. Sort your pictures to put each of the same picture in one pile. Answer the questions on the worksheets and then glu
Subjects:
Grades:
PreK - 12th
Types:
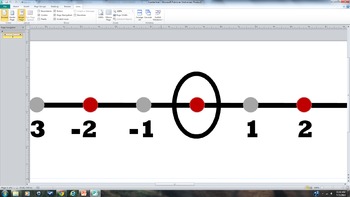
Printable Banner Number Line from -18 to +18 Red, Black and Tan
Printable Banner Number Line from -18 to +18 Red, Black and Tan Print out this Microsoft Publisher File, and you will have your own custom number line! This one is black, red and tan. I made this to fit the decorating needs of my middle school classroom! It will not distract students, but is very visually appealing from anywhere in the room.
Grades:
4th - 12th
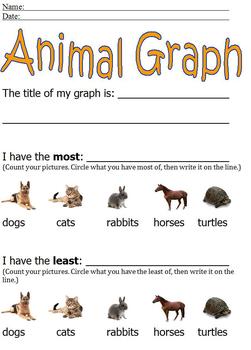
Animal Graphing With Pictures; Simple Cut & Paste; more/less modified curriculum
*****This is the same animal graphing activity found in the animal math packet*****
This is a four-page activity. The third page is all of the pictures that the students will be given by their teacher. These can be cut out individually ahead of time or students can be given a chunk of pictures that they need to cut out. Students should each get 10-15 pictures to graph.
The first page requires students to title their graph, count the pictures to identify most and least, and write in the correc
Subjects:
Grades:
PreK - 12th
Types:
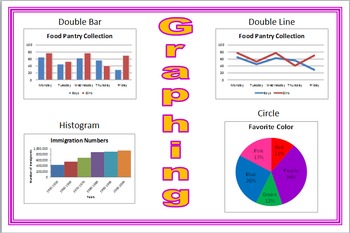
Silent Teacher Poster Types of Graphs
This is a large (2'x3') poster that shows the four most commonly made graphs in upper elementary and middle school math classes, Double Bar, Double Line, Histogram, and Circle (pie). The file is ready to be printed and laminated or can be easily re-sized to fit your needs.

Slope : Rise over Run Poster
This is a poster that I use in my class. Nothing fancy just something I've always used and wanted to share. The poster is a publisher file.
Subjects:
Grades:
7th - 12th
Types:
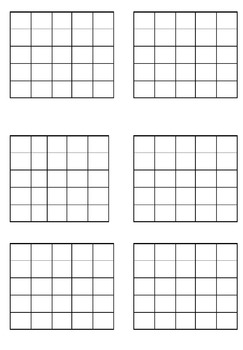
Maths Grids - 5x5 Grids - 6 on a page
Grids that can be used for many different mathematical applications - Matrices, Data Collection, Mapping, Instruction Following.
Subjects:
Grades:
1st - 12th
Types:

Rise over Run Poster
This poster helps students remember the directions RISE and RUN travel.
Grades:
8th - 12th

Central Tendency
I use this for homework, with one week to complete and usually about 30 minutes in class for questions towards the end of the week. The assignment is designed for students to find mean, median, mode, range, standard deviation, and histograms.
Subjects:
Grades:
6th - 9th
Types:
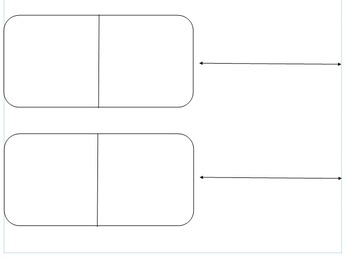
Modeling Equations and Inequalities
My students will model their equation or inequality on the left in the mat and graph it on the number line to the right. It has helped my kids see the modeling and the graph on the same page, side by side.
Subjects:
Grades:
5th - 12th
Types:
Showing 1-9 of 9 results


