6 results
3rd grade graphing audio
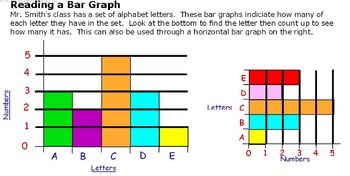
Reading a Bar Graph and Using it Compare Information
This 10 slide Math Activ Studio flipchart teaches students to read a bar graph and use it to compare information. This lesson is aligned with the Houghton Mifflin Math Series, 4.4 - 1st grade, although it can be used to teach concepts in grades K-4. This lesson begins with the “Problem of the Day” in which students are given a weather pictograph and a corresponding word problem in which they solve by reading the pictograph and comparing information. Next, the flipchart displays the daily objec
Subjects:
Grades:
K - 4th
Types:

Make and Use a Pictographs
This 9 slide Math Activ Studio flipchart teaches students to make and use pictographs to compare information.This lesson is aligned with the Houghton Mifflin Math Series, 4.3 - 1st grade, although it can be used to teach concepts in grades K-4. This lesson begins with the “Problem of the Day” in which students are given a word problem that uses critical thinking to determine the number of teeth the students in the class lost. The students can use the visual manipulatives on the Promethean Boar
Subjects:
Grades:
K - 4th
Types:
Using Tally Charts to Make Bar Graphs
This 8 slide Math Activ Studio flipchart teaches students how to use a tally chart to make a bar graph. This lesson is aligned with the Houghton Mifflin Math Series, 4.5 - 1st grade, although it can be used to teach concepts in grades K-4. This lesson begins with the “Problem of the Day” in which students are given information and they must visualize what the bar graph that goes with that information would look like - the teacher will then move the black square to reveal the bar graph. Next, t
Subjects:
Grades:
K - 4th
Types:
Reading and Using Pictographs
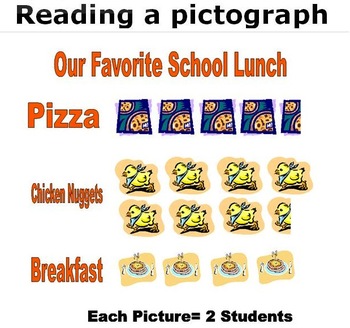
This 11 slide Math Activ Studio flipchart teaches students to read and use pictographs to compare information.This lesson is aligned with the Houghton Mifflin Math Series, 4.2 - 1st grade, but can be used for a variety of grade levels. This lesson begins with the “Problem of the Day” in which students are given word problem that reviews tally marks that they must solve before moving onto pictographs. Next, the flipchart displays the daily objective, then reviews vocabulary term(s) needed to un
Subjects:
Grades:
K - 4th
Types:
Representing Data with Tally Marks
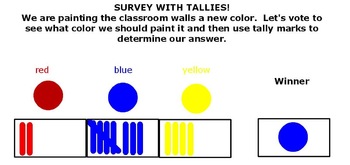
This 10 slide Math Activ Studio flipchart teaches students to represent data with tally marks on a chart. This lesson is aligned with the Houghton Mifflin Math Series, 4.1 - 1st grade. This lesson begins with the “Problem of the Day” in which students are given word problem in which they must solve using the visual manipulatives (plants) to subtract. The student can manipulate and use the “cross out” technique with the visual manipulatives on the flipchart. Next, the flipchart displays the dai
Subjects:
Grades:
PreK - 3rd
Types:

Mr. Duey- Hip Hop Song Teaching Point Plotting
This song teaches how to plot points on a graph.
Grades:
PreK - 12th, Higher Education, Adult Education, Staff
Types:
Showing 1-6 of 6 results


