168 results
3rd grade graphing resources for SMART Notebook
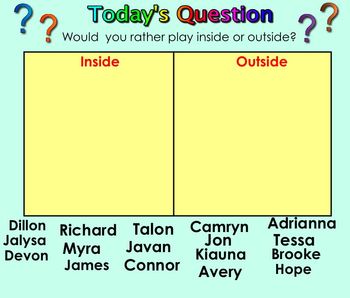
100 Questions of the Day for Smartboard-Kindergarten
This 100 page Notebook file is designed for students to answer a Question of the Day and tally results. This is part of our math program to teach counting skills, tallying, comparing numbers, fewer, least and answer How Many More Questions. The students are also practicing number writing and learning about one another. My students love to try and read the question of the day and vote.
Grades:
PreK - 3rd
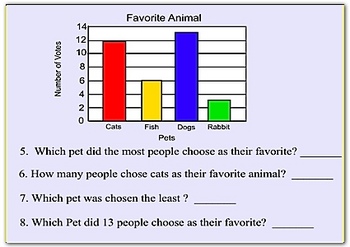
Bar Graphs - Math Smartboard Lessons
This 21 page math smartboard lesson introduces bar graphs and allows students to practice the skill. This math lesson is made so student come to the board and click on the correct answer. When they click on the answer it links to a page that will congratulate them or tell them to try again. Made by Scott OToole (Scott OToole)
Bar Graphs, Smartboard interactive lessons, interactive bar graphs, graph lessons, smartboard lesson, lessons for smartboard, smartboard math lesson, math smartboard les
Subjects:
Grades:
3rd - 6th
3rd Grade Math Jeopardy SMARTboard Review ~ CCSS ALIGNED!
This is a SMARTboard .notebook file that reviews 3rd grade math standards.
CCSS Standards Addressed
3.NBT Numbers and Operations in Base Ten
3.NF Numbers and Operations in Fractions
3.NA Numbers and Algebraic Reasoning
3.MD Measurement and Data
3.G Geometry
The preview file contains information for the file and how to play the game. I have left multiple questions live so you can see exactly how the pages link while playing the game. You will notice on the gameboard that all the red numbers ar
Subjects:
Grades:
3rd - 4th
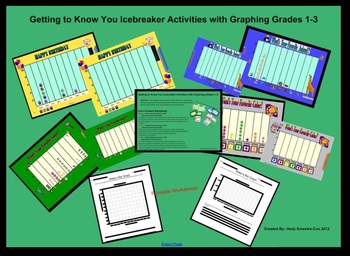
Getting to Know You Icebreaker Activities w/ graphing using smartboard Grade 1-3
Getting to know you icebreaker activities with graphing for Grades 1-3 .This Smart Notebook file was created to use with your Smartboard. This 12 page file is a great lesson to use on the first day of school. This lesson will help you get to know your students and help your students feel at ease while collecting data and graphing. This file includes four interactive graphs, Objectives with the Core Content Standards, student worksheets, and even a Happy Birthday tune to use throughout the year.
Grades:
1st - 3rd
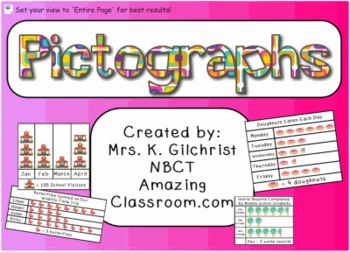
Pictographs - Picture Graph SMART Notebook (Smartboard) Lesson
Teach your students all about picture graphs with this pictograph Smartboard file.
This lesson begins with an explanation of pictographs, then has several questions and opportunities for students to vote such as: How many more?, Who has the fewest?, How many combined in all? This Smart Notebook file finishes with 3 pages where students have to read the statements and complete the pictograph to match each statement.
Great for multiple grade levels!
Subjects:
Grades:
2nd - 6th
Types:
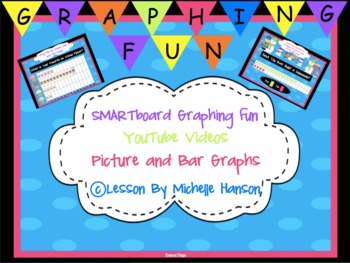
Graphing Unit for SMARTBoard Interactive
SMARTBoard Graphing Interactive Unit
YouTube Videos
Lost Tooth Tally
Favorite Animal
Favorite Fruit
Favorite Ice Cream
Have you ever been on an airplane?
M&M's in a Bag
Have you ever built a snowman?
Balloon Graph with questions
Rain Picture Graph with questions
Everything you need to teach picture and bar graphs.
Check out My SMARTBoard Calendar Morning Math Meeting
Click here to visit my store, SMART Calendar Morning Math Meeting!
If you don't have a SMARTBoard, you can still use this
Subjects:
Grades:
1st - 3rd
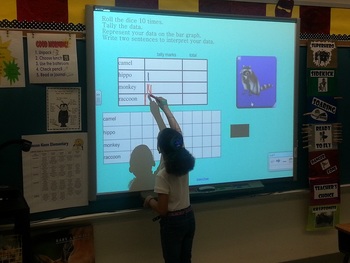
Bar Graph Smartboard Center Activity
These interactive slides are designed to effectively integrate technology into your classroom and provide students with an independent or collaborative math center activity creating bar graphs.
They will organize/collect data by rolling the picture dice.
They will represent their data by filling in a bar graph.
They will interpret their data by writing 2 sentences comparing the information on the bar graph.
Students love this bar graphing center!
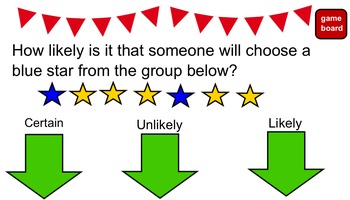
3rd Grade Math SOL Carnival Review Game
This Jeopardy style game, with a carnival twist, helps to review for the 3rd grade math SOL test. Topics covered include, geometry, measurement, time, probability, patterns, properties, and graphing. Students will love reviewing with this interactive game. THIS IS A SMART NOTEBOOK FILE AND WILL ONLY WORK WITH A SMART BOARD AND SMART NOTEBOOK SOFTWARE.
Subjects:
Grades:
2nd - 4th
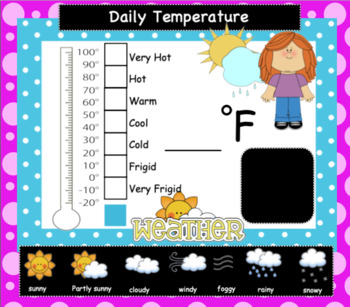
Weather Smartboard Interactive Graphing
This Smartboard lesson will provide you with two interactive graphing pages for discussing the weather. I offer two different options - one with a monthly graph and one with a thermometer. In addition, you will find detailed instructions on how to use the pages and how to link your local weather to the page.I like to add the pages to my morning math routine. Check out My SMARTBoard Calendar Morning Math MeetingClick here to visit my store SMART Calendar Morning Math Meeting!If you don't have
Grades:
PreK - 3rd
Types:
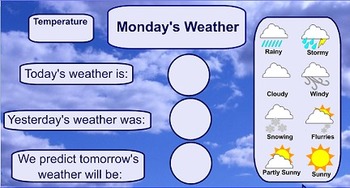
Weekly Weather Chart - SMARTboard
A perfect addition to a primary grade's morning routine, this weekly weather chart allows for students to describe yesterday's/today's/tomorrow's weather as well as make a bar graph detailing the overall weather for the week.
Subjects:
Grades:
PreK - 4th
Lines and Slope Jeopardy Review Game
This Jeopardy Smartboard game assesses the following skills
- types of lines (vertical, horizontal, positive and negative slope) and their equation formats
- calculating slope given two points
- finding x and y intercepts
- determining whether or not a point is on a line
About my Products:
While the PARCC assesses many of the mathematical practice standards, I aim to create many problems and activities that require students to apply the skills outlined in the performance level descriptors. I b
Grades:
3rd - 12th, Higher Education, Adult Education, Staff
Types:
Engage NY Math Grade 3 Module 6 SMART Board
Save hours of time and engage your students with these SMART Board lessons for Engage NY Grade 3 Module 6.
50 slides that will make the teaching of this module a breeze. Graphs and line plots to help teach the graphing concepts in a visually appealing way!
Check out my other modules:
Engage NY Math Grade 3 Module 2
Engage NY Math Grade 3 Module 4
Engage NY Math Grade 3 Module 5
Grades:
3rd
Types:
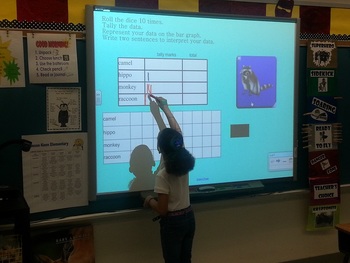
Pictograph Smartboard Activity
These interactive slides are designed to effectively integrate technology into your classroom and provide students with an independent or collaborative math center activity creating pictographs.
They will organize/collect data by rolling the picture dice.
They will represent their data by filling in a picture praph.
They will interpret their data by writing 2 sentences comparing the information on the picture graph.
Students love this bar graphing center!
Grades:
K - 3rd
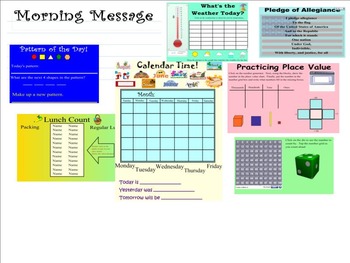
Calendar Corner - Morning Routine Smartboard Lesson
Great way to start your day with a morning routine that includes:
Morning Message
Pledge of Allegiance
Lunch Count (serves as attendance taker!)
Weather/Graphing - linked to weather website
Patterning slide
Place Value
Calendar
Counting using the number grid
Use year-after-year!
Calendar corner smartboard lesson, daily warm up lessons
Grades:
K - 5th
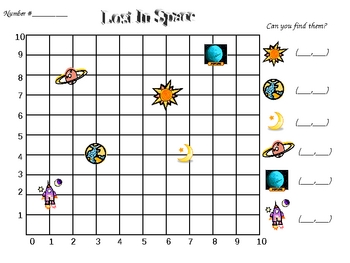
Space Coordinate Grid
Students discover how to read and plot space objects on a coordinate grid. Students learn the easy way to remember the clue of "dribbling and shooting" to plot or read the graph. There is a student sheet embedded in the attachments file section of this SmartBoard lesson.
Subjects:
Grades:
1st - 4th

Introduction to Line Graphing (A Smartboard Presentation for 3rd - 5th Grade)
Graphs are terrific organizers! They can present information in a useful, accessible way. However there are so many things to remember when setting up a graph.
This Smartboard presentation goes through the basics of setting up a line graph, starting with the x and y axis, how to organize the information on each axis, how to plot points, and label information on a graph. This is a great introduction that touches on all of the basics of graph organization and set up.
Subjects:
Grades:
3rd - 5th
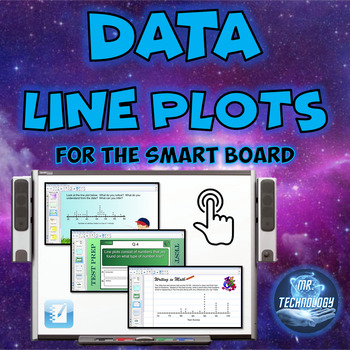
Data Line Plots for the SMART Board
Data Line Plots for the SMART BoardOur Common Core interactive SMART Board Data Line Plots lesson allows students to manipulate line plots on the board to help them understand what line plots are as well as the ability to understand how to interpret the data that is associated with them.The lesson also focuses on writing and explaining their thinking when analyzing the data that is in a line plot by tapping into students' inference skills. Interactive SMART file also includes an interactive fiv
Subjects:
Grades:
3rd - 5th
CCSS:
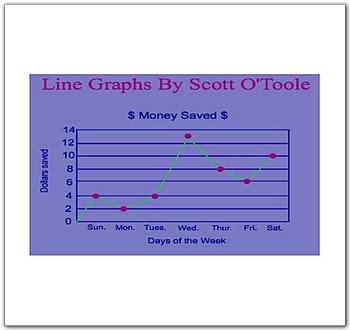
Math Smartboard Lessons Line Graphs
This 24 page math smartboard lesson introduces line graphs and allows students to practice locating the anwswer on a line graph. This math lesson is made so student come to the board and click on the correct answer. When they click on the answer it links to a page that will congratulate them or tell them to try again. Made by Scott OToole (Scott OToole)
Line Graphs, Smartboard interactive lessons, interactive line graphs, graph lessons, math smartboard lesson, lessons for smartboard, smartbo
Subjects:
Grades:
1st - 5th
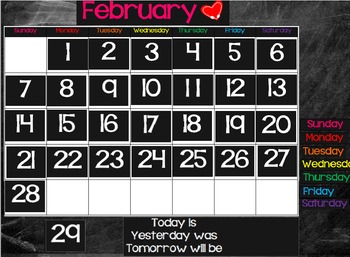
Morning Calender
Interactive smartboard for your morning meeting. Editable calender so students can drag to fill out calender each day. Corresponding month labels are provided in addition to the following pages:
Weather Graphing
Days in school with tens and ones
Number Talk
UPDATED 3/3/2016
Subjects:
Grades:
PreK - 3rd
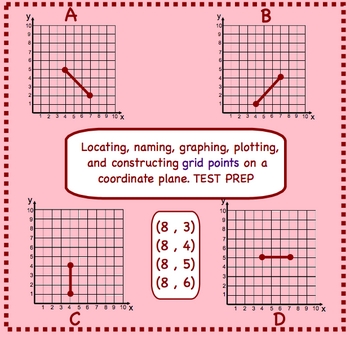
Ordered Pairs on a Coordinate Plane Smartboard Math Test Prep Lesson
This 21-page math smartboard lesson is an interactive lesson that covers ordered pairs or grid points. The students come to the board and locate, name, construct and plot these points on the first quadrant of the coordinate plane. As the students find the correct answer it will link to a page congratulating them or telling them to try again. The students also drag and write correct answers on the board. Made by Scott OToole (Scott O'Toole)
ordered pairs on the first quadrant of the coordinate
Subjects:
Grades:
3rd - 5th
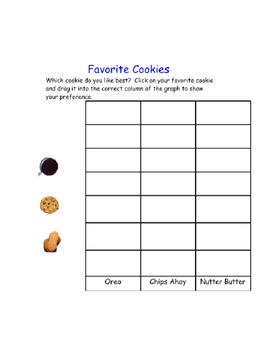
Favorite cookie graph SMART Board activity
This is an interactive SMARTBoard graphing activity. Students select their favorite cookie and drag the image into the correct location on the graph. After students have built the graph there are questions on the following page that can be utilized. Please note that the preview file is a pdf image so not interactive and appears blurry. The SMARTBoard file itself is not blurry.
Grades:
PreK - 3rd
Smartboard: Graphing
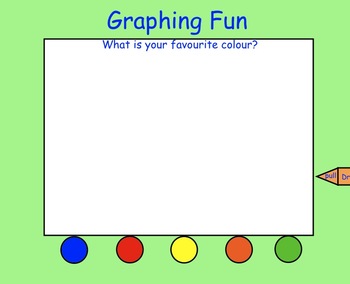
This is a Smartboard Interactive Whiteboard Lesson. There are 5 pages in this file. Each page contains a different survey question and has an interactive graph. Students will come to the smartboard and drag an item on the graph. For example, on the "Favourite Fruit" graph students will drag their favourite fruit onto the graph.
Subjects:
Grades:
PreK - 3rd
Grade 3 Math Module 6 Topic A
Topic A begins with a
lesson in which students generate categorical data, organize it, and then represent it in a variety of forms.
Drawing on Grade 2 knowledge, students might initially use tally marks, tables, or graphs with one-to-one
correspondence. By the end of the lesson, they show data in tape diagrams where units are equal groups
with a value greater than 1. In the next two lessons, students rotate the tape diagrams vertically so that the
tapes become the units or bars of scaled graphs
Subjects:
Grades:
3rd
Types:
Tables, Graphs, and Charts Challenge SMARTBOARD
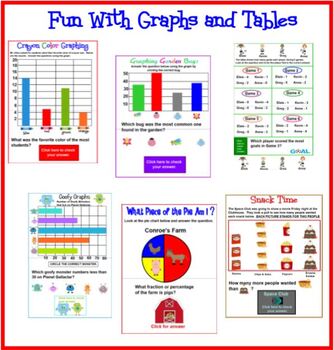
This SMARTboard lesson provides a lesson and practice in interpreting information from graphs and tables. Horizontal and Vertical bar graphs, pie charts, and pictographs are all included. There are 6 different themed graphs with 4 slides per theme so there are a total of 24 graphs and questions. This would be great to use as a mini lesson for 6 days. Introduce each type of graph and practice interpreting the information from the graph on 4 slides each day. Colorful and engaging pictures make
Subjects:
Grades:
2nd - 5th
Showing 1-24 of 168 results


