141 results
Adult education graphing resources for Microsoft Word
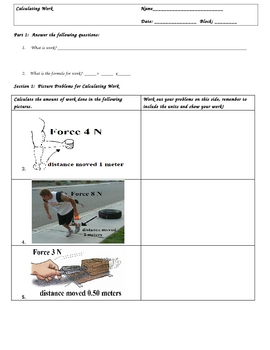
Calculating Work (W=Fxd) Worksheets and Key
Calculating Work (W=Fxd) Worksheets and KeyIf you have been teaching a Simple Machines or Energy Unit, then you need to check out this three page lesson to teach calculating work. It is in three sections.Section 1: Picture QuestionsSection 2: Word Problems/with Challenge QuestionsSection 3: Charting/Graphing ProblemsAll problems are worked out and the key is included.These worksheets include the renown Triangle Method, which has been a proven problem solver for students who struggle in math.The
Subjects:
Grades:
3rd - 12th, Higher Education, Adult Education
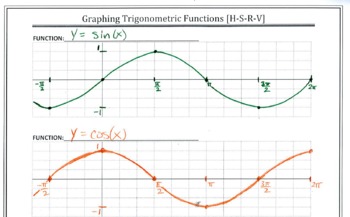
Graph Paper for Trig Functions
This changes everything! Student work becomes more consistent. Your grading will be so much easier! Using the four aligned graphs makes translations of trig functions crystal clear. This file has 2 pages of coordinate planes for graphing trig functions.The first page contains four blank graphs per page. The axes are unlabeled so that students may select their own scale.The second page has five blank graphs per page and is set up for conducting transformations on the coordinate plane.Please see
Subjects:
Grades:
10th - 12th, Higher Education, Adult Education
Interpreting Graphs and Charts
Students work with a variety of 25 graphs and charts and learn how to interpret the information provided. The format varies from one to the other: pie, column bar, horizontal bar, line/dot, and picture (volcano) graphs and table charts. Appropriate for math, Social Studies, ELA, ESL, and Spanish culture. Can be used in Gr. 6-12, adult education, college, and home school. All answer keys provided.
Grades:
6th - 11th, Higher Education, Adult Education
Types:
Constructing Graphs - Bar Graphs, Line Graphs, Circle Graphs
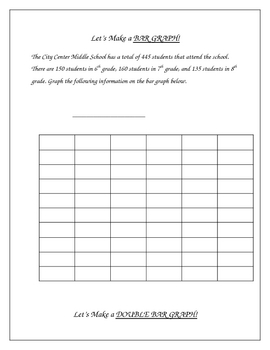
**I revised the numbers in the pie graph on this from the first version, these amounts are much more friendly** This activity includes construction of a bar graph, double bar graph, line graph, double line graph, and a circle graph.I put this together after being frustrated about not being able to find any graphing activities appropriate for intermediate grades that would allow me to make graphs with the class on my smartboard. I needed some examples to demonstrate how to take data and create a
Subjects:
Grades:
3rd - 10th, Adult Education
Types:
Slope Mats: a hands on "puzzle" manipulative for the slope formula
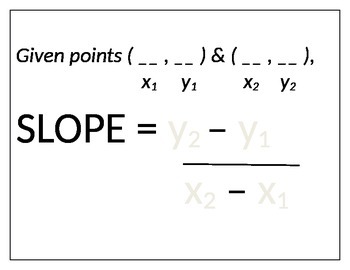
When students begin using the slope formula, getting the right numbers in the correct locations can be difficult for many. Help your students get a handle on this--literally--with this hands on puzzle approach to filling in values in the slope formula. Great for kinesthetic learners. By Michelle Fries
Grades:
7th - 9th, Adult Education
Algebra 1 Calculator Review (TI-84)
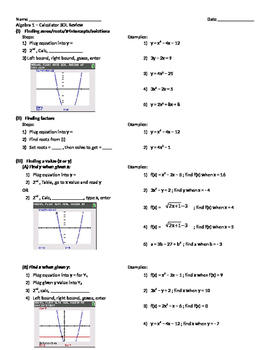
Comprehensive review of all graphing calculator concepts taught through the Algebra 1 course. Review concepts include finding roots, factors, values (x or y), y-intercept, mean, standard deviation, line/curve of best fit, and finding solutions to systems of equations. The review include steps and screenshots of the calculator.
Subjects:
Grades:
7th - 12th, Higher Education, Adult Education
MATH : IDEAS for Hands-On Mini Activities in Middle School!
I have listed six of the many short labs we do in my Pre-Algebra and Algebra 1 classes. These labs take little or no set up with only a few basic materials. The kids love them because they can move around, work with a partner, and it breaks up the formality of a math class. These labs cover area of a parallelogram, percent models, circle graphs, distance between two points, coordinate graphing, parallel lines, systems of equations, graphing, data collection, LCMs, and the Pythagorean Theorem. Th

Snow Science - How Clean IS Our Snow - Hands On Science Experiment
Are you looking for some fun experiments that you can do which includes snow? You have found one! With this experiment, your students can bring the outside - inside. This is the second of two science experiments. You can buy both in the packet or just this one by itself. This experiment is targeted toward helping students understand pollution and why they shouldn't eat snow. I use it to introduce graphing and certain types of weathering. This lesson plan is written in SIOP form. My name is Melan
Subjects:
Grades:
3rd - 8th, Adult Education
Types:
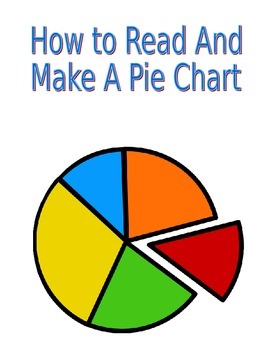
How to Read and Make a Pie Graph
In this handout, students provided with:
- Pie graph definitions
- An example of a pie graph
- Questions to answer the exemplar (basic)
- Step by step on how to calculate pie chart proportions (ideal example for grade 7- 12).
- Step by step on how to calculate angles of proportions
- Step by step on how to calculate percentage for each label.
**protractor needed
Subjects:
Grades:
6th - 12th, Adult Education
Types:
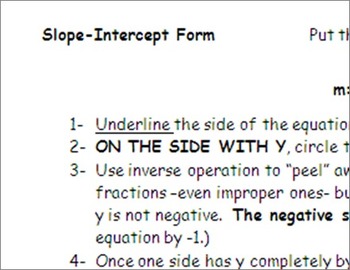
Slope-Intercept Form: Solving for Y
I could NEVER find enough practice on this skill, so I made my own! Hopefully, you will find it as resourceful as I did (and do.)This activity includes 18 equations to place in slope-intercept form. It features a thorough task analysis that takes students through each step of isolating y. To build confidence, the first six equations allow students to solve for y in only one move. The remaining problems involve two or more moves. There are some equations that include fractions and simplifyi
Grades:
8th - 9th, Higher Education, Adult Education
Types:
History of Health Care - My Timeline
Critical Thinking with application of Math using graphics is all in this lesson! Learning how to create a medical timeline is essential for healthcare in today's world. Designing a timeline for the history of healthcare is described in this lesson, however this lesson is designed to allow students to create their own (with parent permission) or to create a "mock design" of a medical timeline may work better for classroom use. This will show the "new" way of presenting medical history to your p
Grades:
9th - 12th, Higher Education, Adult Education, Staff
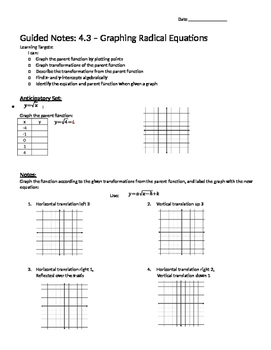
Graphing Square and Cube Root Functions - Notes
Guided notes teaching how to graph square root and cube root functions by translating the parent function. I teach my students to use the "base points" [ (0, 0), (1, 1), and (4, 2) or (-1, -1) for square/cube root] and then transform them using (h, k) or vertex form. They also must be able to determine transformations and equations from a graph. The notes are a summation of the whole unit so they must graph equations at the end and also find the domain/range as well as find x- and y-intercepts a
Subjects:
Grades:
9th - 12th, Higher Education, Adult Education
Types:
6 Editable Bar Graph Templates 2.0
Finally a simple and professional graph space that students can fill out without any design issues getting in the way. This file contains 6 ready-to-use graph options. Print them and have students fill them with pencil and ruler, or distribute them over computer and let them practice entering the data. Get a project perfect finish every time. Maybe you just want to fill it out live on a projector? The possibilities are endless! It's okay to say you love these bar graphs. So do we.Contains:- 2 bl
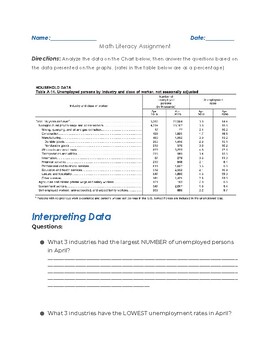
Understanding Unemployment Rates Post COVID-19
This graph displays the unemployment rates for each profession before & after COVID-19. In this activity we will grow to understand the impact COVID-19 has had on the job market.As we can see from the graph, certain professions have been hit harder than others. The hospitality industry, for example, has seen a dramatic spike in unemployment rates since the pandemic began. On the other hand, jobs in healthcare and technology have remained relatively stable.It's important to note that these ch
Subjects:
Grades:
10th - 12th, Adult Education
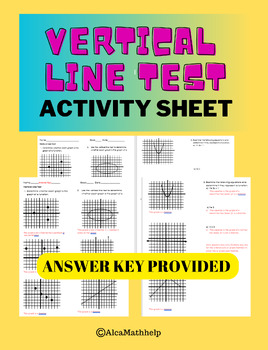
Functions and Relation- Vertical Line Test Activity, Pop Quiz Extra Practice
If you are looking for a resource that is perfect for practice this is the one. No repetition of the same concept just to the point and fun. This activity sheet will give students an opportunity to examine a function or points on a graph and determine if the plotted points form a function or not. This activity will expand on the content taught which will then give them a better understanding of functions. This activity is perfect for a quiz, independent practice, substitute plan, homework or a
Grades:
7th - 10th, Adult Education
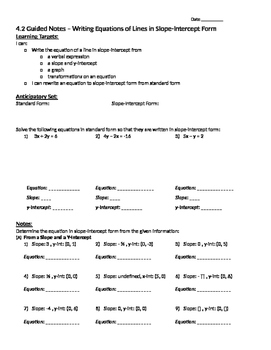
Writing Equations in Slope-Intercept Form - Notes
Guided notes teaching students how to write equations in slope-intercept form when given a graph, a slope and a y-intercept, and a verbal explanation. The notes also teach how to transform equations in slope-intercept form when given vertical shifts and "stretches" in the steepness/flatness of the line. The beginning of the notes also reviews how to find the slope-intercept form of an equation written in standard form by solving for y. I also have a corresponding assignment of the same name.
Grades:
7th - 12th, Higher Education, Adult Education
Types:
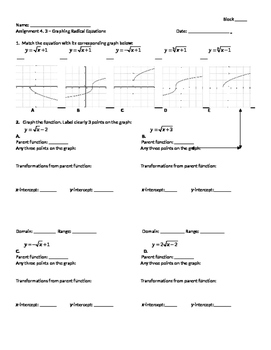
Graphing Square and Cube Root Functions - Assignment
Assignment checking the ability to graph square root and cube root functions by translating the parent function and solving for x- and y-intercepts algebraically. I teach my students to use the "base points" [ (0, 0), (1, 1), and (4, 2) or (-1, -1) for square/cube root] and then transform them using (h, k) or vertex form. They also must be able to determine transformations and equations from a graph included in a matching section. The assignment also has real-world word problems at the end. I al
Subjects:
Grades:
9th - 12th, Adult Education
Types:
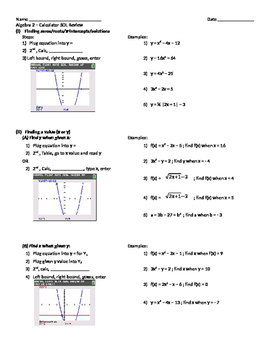
Algebra 2 Calculator Review (TI-84)
Comprehensive review of all graphing calculator concepts taught through the Algebra 2 course. Review concepts include finding roots,values (x or y), mean, standard deviation, line/curve of best fit, minimums/maximums, intervals of increase/decrease, domain and range, and finding solutions to systems of equations. The review includes steps and screenshots of the calculator.
Subjects:
Grades:
9th - 12th, Higher Education, Adult Education
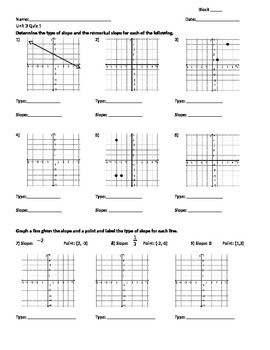
Graphing Linear Equations and Inequalities in Slope-Intercept Form - Quiz
Unit quiz testing the ability to determine the slope of a line, graph given a point and a slope, graph given an equation in slope-intercept form, and graph given an inequality in slope-intercept form. Students must describe the verbal type of slope (positive, negative, zero, undefined) as must be able to determine points in the solution set and not in the solution set. This unit quiz corresponds to my notes and assignments of similar names.
Grades:
7th - 12th, Higher Education, Adult Education
Types:
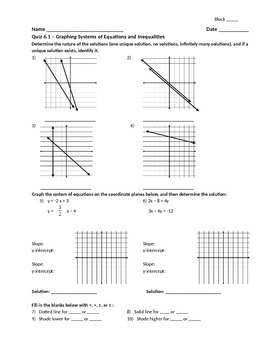
Solving Systems of Equations and Inequalities Quiz
This is a mixed quiz covering solving systems of equations and inequalities graphically, as well as one question on solving a system of equations algebraically. It corresponds well with my notes and assignments of the same names ("Solving Systems of... - Notes", etc) and it is meant to be taken without the use of a calculator (all graphs drawn by hand).
Grades:
7th - 12th, Adult Education
Types:
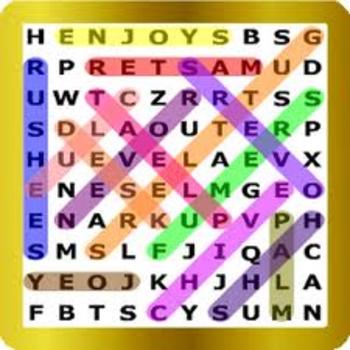
Transformations Word Search
Transformations Word Search
23 words to find about Transformations
You may also be interested in my other top-selling products:
EQUIVALENT FRACTIONS (33 Items)
Fractions 10 Pages of Practice (191 questions)
Fractions Review and Reinforcement
Fractions Test (15 Q)
4th Grade Word Problems Quiz (10 Q)
Equations and Inequalities Quiz (20 Questions)
Evaluate Expressions Quiz (22 questions)
Pairs of Lines Quiz (17Q)
Decimals, Fractions and Percents Quiz (10 Q)
Order of Operations Quiz
Grades:
3rd - 12th, Higher Education, Adult Education, Staff
Types:
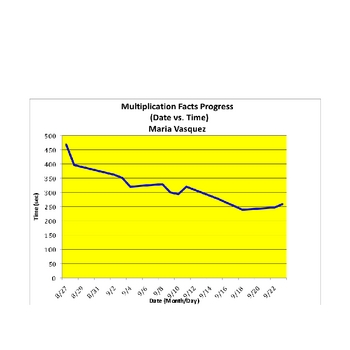
Multiplication Math Facts, Data Collection, and Line Graph Mastery
Multiplication Facts Practice, Data Collection, and Line Graph Mastery: Motivational Tool and Unit Project
This project is designed to provide students with a motivational tool to conquer and master their multiplication math facts. Students race against themselves and the clock with a daily timed practice of a multiplication table covering factors 1-12.
Students are taught to check their own answers, record their results in a data table over an extended period of time, convert units from minu
Subjects:
Grades:
3rd - 6th, Adult Education
Graph Paper 16
This is a free sample of graph paper in Word format. Simply print out the page, or use it onscreen with an interactive whiteboard. This particular graph is 14x14, with subgrids equaling 28x28. It is one of 30 graph papers included in Graphs Grids & Games, a digital document by John Rice available on TeachersPayTeachers.com
Grades:
PreK - 12th, Higher Education, Adult Education
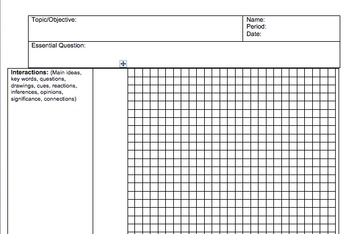
Cornell Notes for Graphing - Math/Science (editable)
Similar in design to my free Cornell Notes template, this template includes 2 pages for graphing and taking notes on it. The right side of both pages is graph paper with room for labels and increments and the left side is room for notes and prompts for students to reflect on their graphs. The document is compatible with word and able to be edited to reflect specific needs you may have.
Grades:
3rd - 12th, Higher Education, Adult Education
Showing 1-24 of 141 results


