12 results
Adult education graphing resources for Microsoft Excel

Excel Spreadsheets Million Dollars Activity
This resource allows students to understand the following: How graphs change when spreadsheet data is alteredUse of SUM() functionsHow graphs are madeComponents of a graphAdvantages of spreadsheets over pen and paper methodsStudents use this resource to understand how altering data in spreadsheets allow graphs to change. They understand such concepts by trying to spend a Million Dollars in a minute. Students are then expected to complete the associated worksheet which accompanies the spreadsheet
Grades:
5th - 12th, Adult Education
Types:
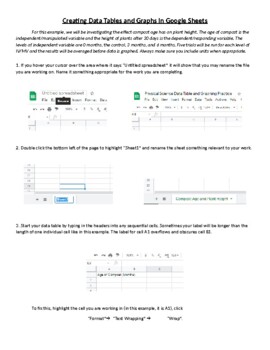
Creating Data Tables and Graphs in Google Sheets
This is an activity that walks students through the process of organizing and entering data into a data table and then using that data to generate line, bar, and pie charts. Once the graphs are generated, the process of formatting and editing the different parts of each graph is explained.

Parabola Transformations - Interactive
A handy guide to help new students learn how each change affects the shape and direction of parabolas. Clear color coding for the various pieces of the formula and instant updates help separate and isolate the concepts for easy, intuitive learning.Enter information using simple dropdown menus and organized blank fields to isolate each piece of the formula!Two tabs:One allows you to enter individual pieces of information to show the resulting formulaOne allows you to enter the formula to show the
Subjects:
Grades:
7th - 12th, Higher Education, Adult Education
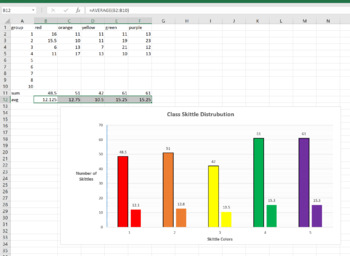
Skittle Statistics MS Excel Mini-Lab
This is a 1 class MS Excel lab for a computer or math class. You can have the students explore the distribution of different color Skittles in class. This is a great mini-lab or half-day activity when you school ends up with a weird schedule day. Tell them they can't eat till the Skittles till the end of class, or they will distort their numbers. Also make sure they don't throw them or shove them up their nose (Yes, stuck Skittles are hard to extract, ask me how I know..)The goal of this lab is
Grades:
6th - 12th, Higher Education, Adult Education
Types:
NGSS:
MS-ETS1-2
, HS-ETS1-2
, HS-ETS1-3
, MS-ETS1-4
, MS-ETS1-1
...
Also included in: Hands-on Science Semester Labs Bundle
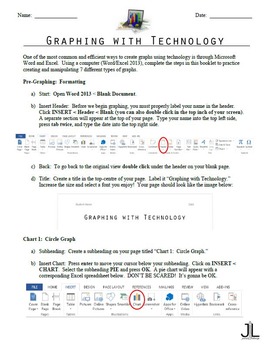
Graphing with Technology (Microsoft Word/Excel 2013)
Help students learn to create graphs using technology! This graphing with technology booklet acts as a compressed guide and practice sheet for Microsoft Word/Excel 2013.
Each graph contains step-by-step directions and screen-capture images so that students will never get lost. In addition, the data used in this assignment is both relatable and engaging for teenage target groups.
By completing this task, students will be able to create 7 different types of graphs using technology:
- pie gra
Subjects:
Grades:
8th - 12th, Higher Education, Adult Education
Types:
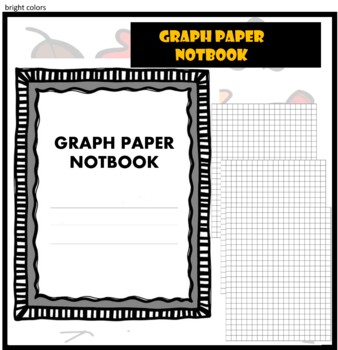
GRAPH PAPER NOTEBOOK
GRAPH PAPER NOTEBOOK 2022This paper book is a 102-page graph paper notebook consisting of pretty little square sheets in plain light blue, paper size 8.5 x 11 inches, 21.59 x 27.94 cm.★ ★This paperbook has several characteristics, including:· Plenty of space for writing or drawing· Font color is light blue· The size of the book is medium and suitable for different users and in different fields.· Pptx file containing lines and frame with transparent backgrounds that can be modified· JPG size 8.5
Subjects:
Grades:
7th - 12th, Higher Education, Adult Education, Staff
IEP Behavior Calculation
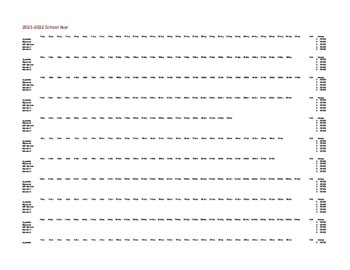
This template is a one stop shop. Insert your data and the rest is done for you. In this template you have the entire year month by month. Each month has 5 behaviors that you can calculate. Once you enter your numbers, the template will calculate the total and average, for each behavior, for that entire month. Once your month is filled out, you will go to the graph page where all your data will be graphed out for you.
Grades:
PreK - 12th, Higher Education, Adult Education
Types:

Quadratic Graph Maker (Excel Templates)- Standard, Vertex, and Factored Forms
Easily Generate a Quadratic Graph/Parabola from a Template for Worksheets/Lessons/Notes:The Quadratic Graphing Template Excel file allows you to enter values into a table of values to easily create graphs of parabolas for any of the three forms (standard form, vertex form, factored form); all three forms of the equation are contained in one Excel file.The template is designed to include the vertex and 8 points before and after the vertex (the coordinates of the vertex in the table of values are
Subjects:
Grades:
9th - 11th, Adult Education, Staff
Basics of Excel: Working With Charts and Data on Macs
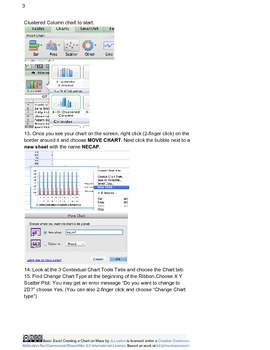
Step by Step lesson on creating charts, sorting and manipulating data in Excel Mac Version. This is a lesson for teachers trying to use assessment or other data to report or as a student lesson on using Excel.
Grades:
4th - 12th, Higher Education, Adult Education, Staff
Types:
Functionator 5000 A graphing calculator/equation editor decay & growth
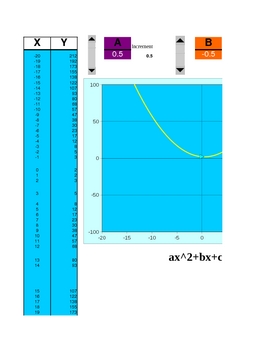
I built this Excel document to show what happens to lines and tables when you change variables and constants within an equations. There are three sheets:
y = mx+b
ax^2 + bx +c =0
c = p(1-r)^t
For instance, on the linear equation sheet, you can change m & b separately to see changes in the table and the graph. You can trace all equations. Much fun can be had.
Subjects:
Grades:
5th - 12th, Higher Education, Adult Education
Types:
Straight lines instantly produced on excel
Straight lines
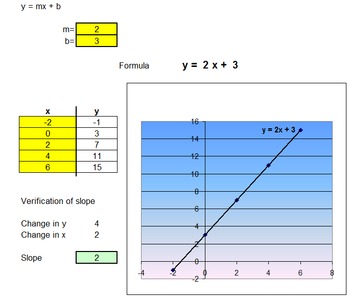
This excel sheet instantly generates a straight line graph using the format
y = m x + b
By inserting a value for slope (m) and y intercept (b) the graph is produced.
The chart also creates the table of values.
Insert any values for x and the y values are calculated.
Slope is verified by displaying the change in y and x.
Ask your students to draw a line with a slope of two and an intercept of three.
Types those numbers into the cells for slope and intercept and the graph is d
Subjects:
Grades:
8th - 10th, Adult Education

Terminal Velocity Simulation Written on a Spreadsheet
EXPAND THE USE OF SPREADSHEETS IN YOUR PHYSICS CURRICULUM... This Physics activity good for all levels of Physics is a free preview of "The Spreadsheet Lab Manual." It guides students to construct a mathematical simulation starting from a blank spreadsheet that quantitatively models freefall with air resistance as an object reaches terminal velocity. Students will be guided through an inquiry based simulation as they answer assessment questions and gain skills on spreadsheets while manipulati
Subjects:
Grades:
9th - 12th, Higher Education, Adult Education, Staff
Types:
Showing 1-12 of 12 results


