817 results
2nd grade graphing resources for Microsoft Word
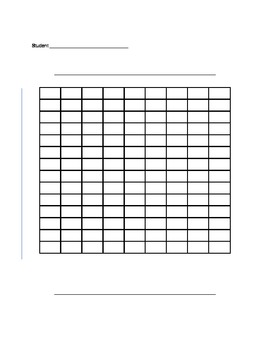
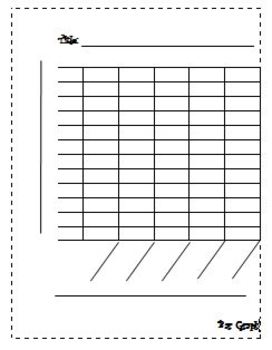
Blank Bar Graph/Double Bar Graph Template
This is a bar graph template that can be used by teachers to teach students how to understand bar graphs and create their own bar graphs. Teachers can use this template teach students about parts of a bar graph and how to interpret data in bar graphs.
Grades:
1st - 12th
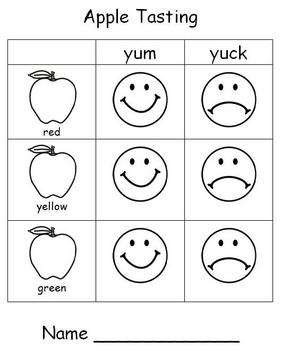
Apple Math - Taste Test Graph
Kindergarten and first grade students can strengthen their graphing skills this fun taste test. After tasting red, yellow and green apples, students fill out an individual graph then choose their favorite and record it on a class graph.
Grades:
PreK - 2nd
Types:
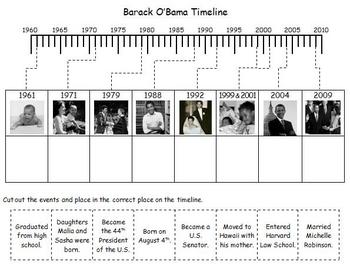
President's Day - Barack Obama Photo Timeline
Students will learn about the important events in Barack Obama's life as they complete this photo timeline. Two versions are included, one for upper elementary and one for lower elementary.
Subjects:
Grades:
1st - 6th
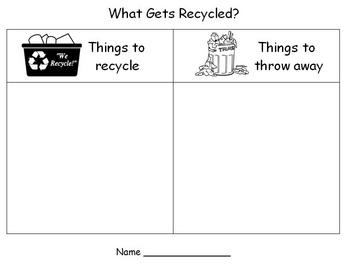
Earth Day - Recycling Sort
Kindergarten and first grade students will increase their knowledge of "Thinking Green" while strenthening their sorting and graphing skills as they complete this "What gets recycled" challenge. A great way to combine math and social studies.
Subjects:
Grades:
PreK - 4th
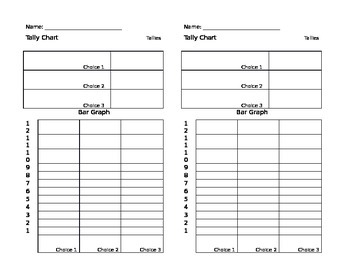
Blank Tally Chart and Graph Paper
This template is designed to let students graph just about anything. Students can start by choosing their own survey question, tallying the results, and making the bar graph.
Documents include 3, 4, and 5 choices for bar graphs. This is a very versatile document to help you with all your graphing needs!
Subjects:
Grades:
1st - 4th
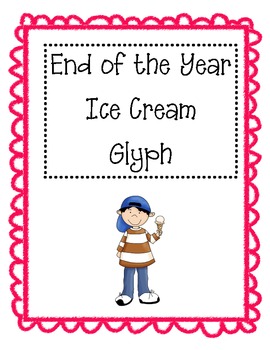
End of the Year Ice Cream Glyph
Students will follow directions to complete their ice cream glyph. When they are finished, have students display their glyph in a central location, such as on a bulletin board or in a hallway. Next, students will complete the "Reading the End of the Year Ice Cream Glyph" page. They will use the information from the whole class's glyphs to complete their pages. It's more fun if the students' names are on the back of their ice cream glyph, so students can guess whose is whose. Afterwards, they can
Subjects:
Grades:
2nd - 5th
Types:
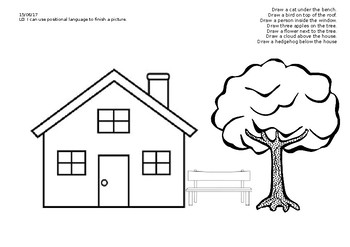
Positional Language
A fun and handy worksheet to determine children's understanding of various types of positional language. Read the instructions at the top and draw the object in the correct place!
Subjects:
Grades:
PreK - 2nd
Types:
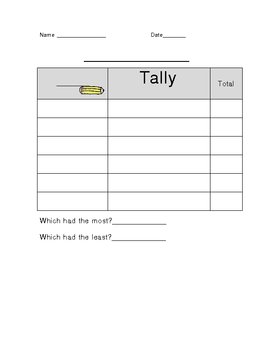
Blank Tally Chart
This Tally Chart can be used in numerous classroom situations. It will help students practice counting with tallies, graphing, etc.
Subjects:
Grades:
PreK - 6th
Types:
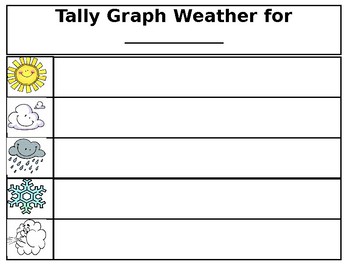
Tally Mark Monthly Weather Graph for Calendar
Tired of using the same weather graph for your calendar time? Look no further! I have included a monthly blank calendar graph using tally marks. You can copy a sheet for each student for their monthly calendar journals. Easy, small and clear for your students to use!
Subjects:
Grades:
PreK - 2nd
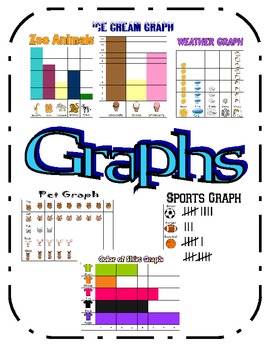
Graphs (Picture, Bar and Tally Marks)
These picture, bar and tally mark graphs can be used in a variety of ways. They can be used to display in a calendar area where you can review daily graphing questions during your calendar time. The students can use the graphs to learn how to write a question about a graph. Worksheets could be created to go with each graph. These graphs could be used in several different grade levels. For example, these graphs relate to the first grade math common core standard 1.MD.4 (Organize, represent,
Subjects:
Grades:
1st - 3rd
Types:
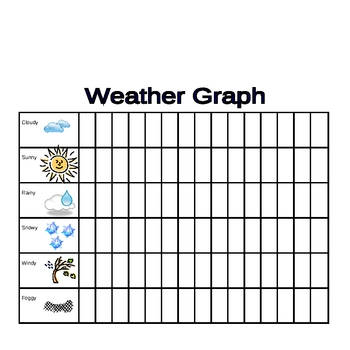
Weather Display / Graph / Pieces / Chart for Calendar w/ Sign Language
I made this weather set for my classroom calendar. I use it with Pre-K, but it is really more appropriate for first and second.
Set includes a display for the weather (I laminated), a chart to graph the monthly weather (I laminated; use wet erase marker to reuse monthly), 10 pieces** (hot, cold, cool, warm, sunny, cloudy, rainy, snowy, foggy, and windy), and a weather sign language chart
**Use Velcro dots to place pieces on and off display
Subjects:
Grades:
PreK - 5th
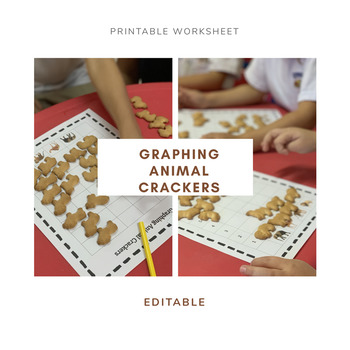
Animal Crackers Graphing
Graphing worksheet with animals from animal crackers packets. Great for a hands-on math lesson! It is editable just in case different animals come in a pack. Also works for centers!
Grades:
PreK - 2nd
Types:
Activities and Games to Teach Self-Regulation: Ideas for Your Elementary Student
A packet of activities/games that can be used in your elementary classroom to help students learn self-regulation, impulse control, making good choices, waiting their turn, and giving words to feelings/emotions.Includes: Games/Activities; Writing ideas; Drawing/Doodling; Discussion Topics; Graphing; Making a Choice worksheets; and more.Can be adapted to many different learning levels by the educator."A wonderful resource for teaching skills for the real world, outside school."
Subjects:
Grades:
2nd - 6th
Types:
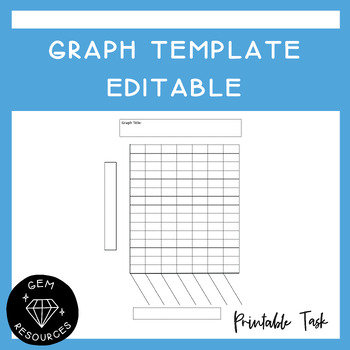
Graph Template Data and Statistics Maths Histogram Bar Column Drawing Editable
Students can use this to help them draw up a graph. It allows them to be accurate and has boxes for the titles needed for the graph.This Word document is editable.
Subjects:
Grades:
2nd - 6th
Types:
Gingerbread Man - Graph
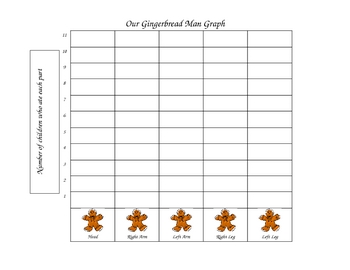
I purchase Gingerbread Man cookies for my kids and pass one out to each child. I tell them they can't eat it until I say. Once all the children have a cookie, I tell them to take only one bite. Once all of the kids have eaten one bite of their cookie, I show the children the graph. I explain to them that we are going to graph which body parts we all ate. We go around the room and each child tells us the part they ate. I color in a copy of the graph on the Smartboard, while the children color in
Subjects:
Grades:
PreK - 2nd
Types:
Officer Buckle and Gloria ~ Math Activity Sheets ~ Houghton Mifflin®
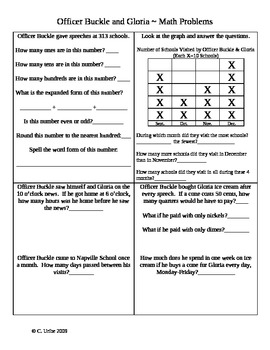
This is a set of four pages with math activities and word problems to go with the Houghton Mifflin reading program story "Officer Buckle and Gloria". The math concepts covered include elapsed time, time relationships, graphing, basic addition and subtraction, multiplication/repeated addition, place value, rounding, expanded form, even/odd, using a chart, regrouping, money, shapes, using tables to solve problems, comparing/ordering numbers, measurement tools and measurement with nonstandard units
Subjects:
Grades:
2nd
Types:
Dr. Seuss Hat Stack Graphing Activity
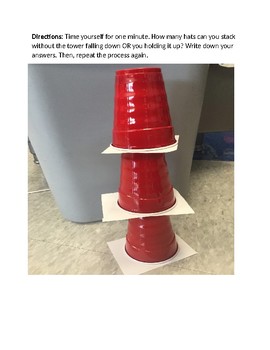
This is a hands-on graphing activity to use during Read Across America or during a Dr. Seuss unit.
In this activity, the students time themselves to see how many hats they can stack. They then create a bar graph of the information they collected.
Grades:
1st - 3rd
Types:
Envisions Math - Grade 1, Topic 14 Lesson Plans
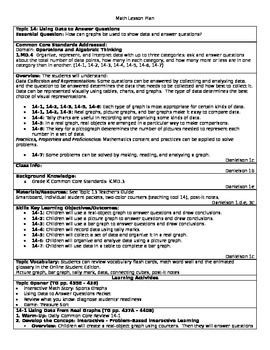
This file contains lesson plans for all of Envisions Math, Topic 14, Using Data to Answer Questions. There are 7 lessons in this unit. Lessons can be edited to include your own class information. All lessons are aligned to the Common Core Standards.
Subjects:
Grades:
K - 2nd
Types:
CCSS:
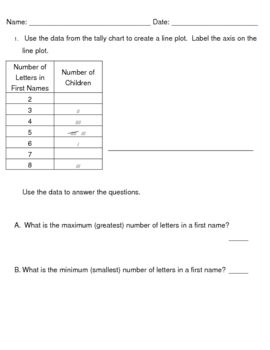
Everyday Math, Grade 3, Unit 3, Tally Chart-Line Plot-Data Practice
Simple 2 question practice to use as a review for students who may need a little bit more help understanding converting data in a tally chart into a line plot. There are questions related to the data about the maximum, minimum, range, and median. It's free, so enjoy it!
Subjects:
Grades:
2nd - 4th
Types:
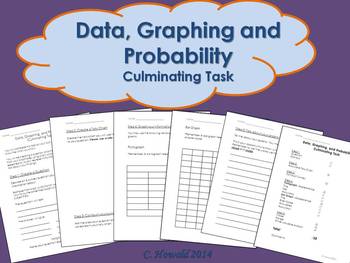
Graphing Unit Culminating Project
I used this activity as a summative assessment for my Data, Graphing and Probability Unit. This gave students the opportunity to create their own question, survey a group of students (visited another class in the school), collect, display and analyze their data.
I have left this as a .doc file so that you are able to adjust it to fit the needs of your classroom.
If you have any questions or concerns, let me know!
Thanks for downloading. Please take the time to rate this product.
If you e
Subjects:
Grades:
2nd - 4th
Types:
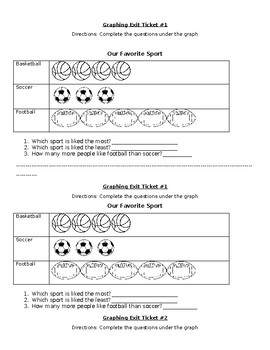
Graphing Exit Tickets
There are 5 graphing exit tickets with 3 questions underneath about each graph. (2 per page)Included: - bar graphs - picture graphs - tally marks
Grades:
K - 2nd
Types:
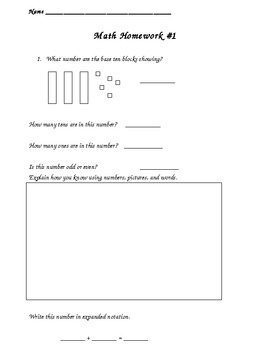
2nd Grade Math Homework
This attachment contains 30 weeks of spiraling math homework. It is based on a 2nd grade curriculum which uses problem based inquiry as its foundation. Concepts such as place value, fractions, money, time, probability,and graphing are covered. Week by week it slowly progresses to become harder and to review concepts previously learned.
Created by lcgorski
Subjects:
Grades:
2nd
Showing 1-24 of 817 results


