123 results
11th grade graphing interactive whiteboards
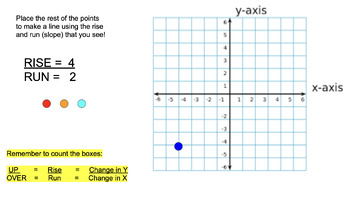
Coordinate Plane, Slope, Rise/Run, Graphing - Online No Prep Bundle
A bundle of activities which can be used as formal lessons or independent practice. Great for Google Classroom or Smart-boards! Also can be used as sub plans! Created by a Special Education Math Teacher to help students become comfortable with graphing!
Grades:
5th - 12th
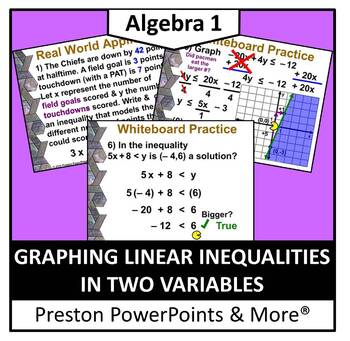
(Alg 1) Graphing Linear Inequalities in Two Variables in a PowerPoint
Algebra 1 Graphing Linear Inequalities in Two Variables in a PowerPoint PresentationThis slideshow lesson is very animated with a flow-through technique. I developed the lesson for my Algebra 1 class, but it can also be used for upper level class reviews. This lesson teaches how to tell whether an ordered pair is a solution of an inequality, write an inequality in slope-intercept form, graph a linear inequality with two variables, and solve a real-life situation by modeling linear inequalities
Grades:
8th - 11th
CCSS:
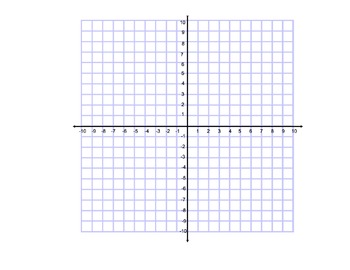
Blank Coordinate Grid
Blank Coordinate grid with all quadrants labeled -10 to 10. Grid is locked in place, though it can be edited. Great for lessons with transformations, or for student who have trouble locating points on a coordinate grid. **Smart Notebook File**Looking for a Google Version? Check out my Google Slides Coordinate Plane for Interactive Notebooks!
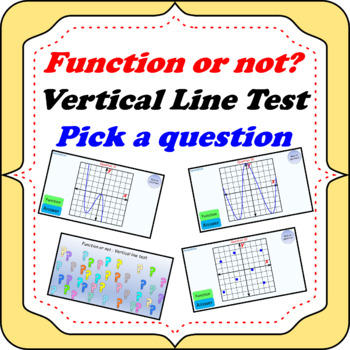
Function or not? Vertical line test. Powerpoint game "Pick a question".
This product contains a PowerPoint with 31 slides. The first slide has 30 question marks.When a question mark is clicked, it goes to a random graph. Students examine the graph and decide if the graph is a function or not.After discussing, they can click on the blue “Answer” button and the graph will be identified as a “function” or “not a function”. If the answer is “not a function”, a straight vertical line will also pass down through the graph, indicating why it is not a function.When the answ
Subjects:
Grades:
9th - 12th, Adult Education
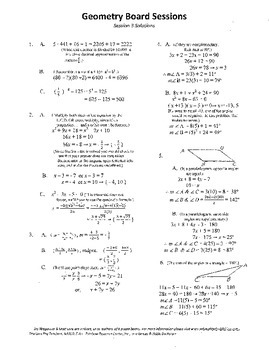
Complete Set 20 Board Geometry Board Sessions,Review WITH Solutions,ACT,SAT
This is the complete set of all 20 Geometry Board Sessions. These twenty sessions will take teacher and student through the entire year of a typical Geometry course at the high school level . . . giving problems that constantly review and blend topics, challenge,"come out " relatively nicely (No calculator is needed.), . . AND each session has a solution sheet with explanations! ( An early aside . . . Though this was NOT their original purpose, any of the twenty sessions included in this pa
Grades:
7th - 11th, Adult Education
CCSS:
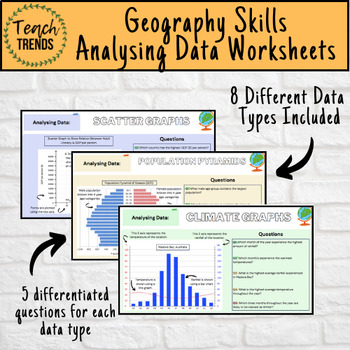
Geography Data Analysis Skills Work Booklet / Activities
Enhance your pupils’ geographical skills with a series of interpretation and analysis sheets and questions. This resource includes 8 PDF slides with corresponding questions all focused on a different data presentation method. Ideal for preparing your pupils for exams and revising analysis skills. The high quality slides include annotations, examples and five scaled-ability questions.The data presentation skills included in this resource are:Climate GraphsPopulation PyramidsChoropleth MapsScatter
Subjects:
Grades:
8th - 12th, Adult Education
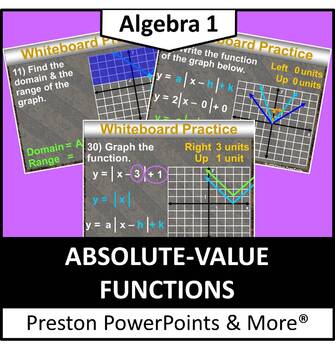
(Alg 1) Absolute Value Functions in a PowerPoint Presentation
Algebra 1 Absolute Value Functions in a PowerPoint PresentationThis slideshow lesson is very animated with a flow-through technique. I developed the lesson for my Algebra 1 class, but it can also be used for upper level class reviews. This lesson teaches how to complete an absolute value function table, find the domain and range of an absolute-value functions. graph an absolute-value function, and identify transformation of an absolute value functions.This lesson has SKELETON NOTES, notes that
Grades:
8th - 11th
CCSS:
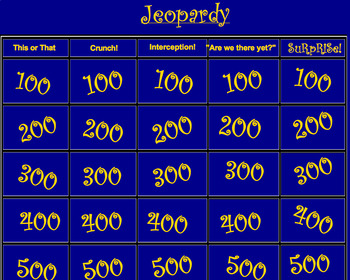
Lines and Slope Jeopardy Review Game
This Jeopardy Smartboard game assesses the following skills
- types of lines (vertical, horizontal, positive and negative slope) and their equation formats
- calculating slope given two points
- finding x and y intercepts
- determining whether or not a point is on a line
About my Products:
While the PARCC assesses many of the mathematical practice standards, I aim to create many problems and activities that require students to apply the skills outlined in the performance level descriptors. I b
Grades:
3rd - 12th, Higher Education, Adult Education, Staff
Types:
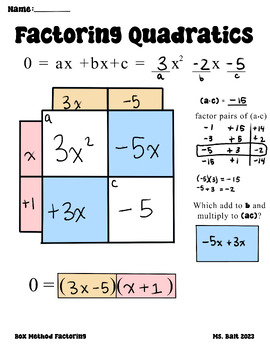
Factoring Quadratics by Box Method Template for Whiteboard Doodle Note Exemplar
Unlock the secret to mastering complex trinomials with our 'Factoring Quadratics by Box Method' template! Designed to demystify the process of factoring quadratics, this versatile tool is a must-have for students and teachers alike. Whether you're a student looking to boost your math skills or a teacher searching for a classroom aid, 'Factoring Quadratics by Box Method' is your solution. With exemplar problems and a user-friendly design, it's perfect for keeping in your notes, laminating for rep
Grades:
6th - 12th
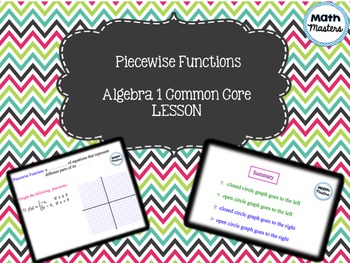
Piecewise Functions Lesson 1 of 2
This is an Algebra 1 Common Core Lesson on Graphing Piecewise Functions. This is Lesson 1 of 2. For Lesson 2 of 2 which can be used as a follow-up on Day 2 (which includes homework for either lesson), click the link below.
Click here for Lesson 2 of 2!
Students will explore piecewise functions through graphing. After a few teacher led examples, students will practice on their own or in groups.
Includes:
-Lesson & Teacher Answer Key PDF
-Lesson & Teacher Answer Key Smartnotebook Fi
Subjects:
Grades:
7th - 12th
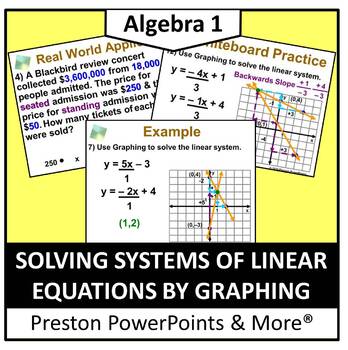
(Alg 1) Solving Systems of Linear Equations by Graphing in a PowerPoint
Algebra 1 Solving Systems of Linear Equation by Graphing in a PowerPoint PresentationThis slideshow lesson is very animated with a flow-through technique. I developed the lesson for my Algebra 1 class, but it can also be used for upper level class reviews. This lesson teaches how to write and solve a system of linear equations by graphing, and solve a real-life problem modeling a linear system, such as the number of people at a concert.This lesson has SKELETON NOTES, notes that have the proble
Grades:
8th - 11th
CCSS:
Statistics Activity
This powerful activity focuses on using the TI 84+ calculator to calculate the mean, median, range, z-score, standard deviation, mean absolute deviation, permutations, combinations, and probabilities with normal distribution. You will also gain insight on how to create multiple box and whisker plots on one graph.
This is aligned to the Common Core and VA SOLs A.9, A.10, AII.11, and AII.12.
Subjects:
Grades:
7th - 12th
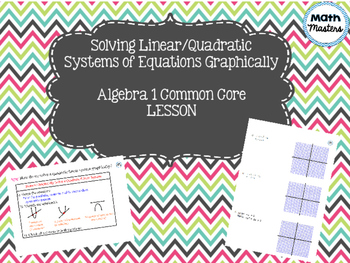
Solving Linear Quadratic Systems of Equations Graphically
This is an Algebra 1 Common Core Lesson on Solving Linear/Quadratic Systems of Equations Graphically. Students will review graphing linear and quadratic functions & discuss the possible solution(s) of the systems. After a few teacher led examples, students will practice on their own or in groups.
Includes:
-Lesson & Teacher Answer Key PDF
-Lesson & Teacher Answer Key Smartnotebook File
-Student Worksheet PDF
**This lesson is part of the Comparing Functions Unit Bundle. Please c
Grades:
7th - 12th
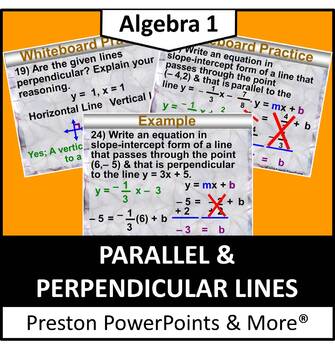
(Alg 1) Parallel and Perpendicular Lines in a PowerPoint Presentation
Algebra 1 Parallel and Perpendicular Lines in a PowerPoint PresentationThis slideshow lesson is very animated with a flow-through technique. I developed the lesson for my Algebra 1 class, but it can also be used for upper level class reviews. This lesson teaches how to identify lines that are parallel and perpendicular, find parallel and perpendicular slopes of linear equations, write linear equations of lines that are parallel and perpendicular using a point, y-intercept and horizontal and ve
Grades:
8th - 11th
CCSS:
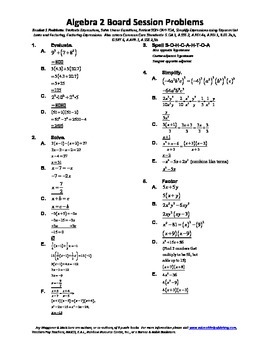
High School Algebra II,Trigonometry,Mathematics,activities,Combo Package 15
Here’s a package of Algebra II and Trigonometry activities bound to please any Algebra II teacher . . . a great present for yourself, or a favorite teacher. The “combo” includes three different forms of activities geared to improving the atmosphere and the testing scores of any Algebra II classroom . . . and it’s priced at a 21% discount from buying the three items separately. Included are: the complete set of Algebra II Board Sessions WITH SOLUTIONS not just answers ($19.95), the complete set o
Subjects:
Grades:
10th - 12th
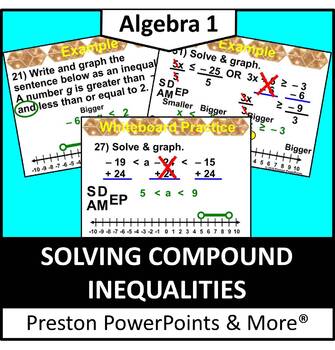
(Alg 1) Solving Compound Inequalities in a PowerPoint Presentation
Algebra 1 Solving Compound Inequalities in a PowerPoint PresentationThis slideshow lesson is very animated with a flow-through technique. I developed the lesson for my Algebra 1 class, but it can also be used for upper level class reviews. This lesson teaches how to write, solve and graph compound inequalities and solve real-life situations using compound inequalities to model making weight in wrestling.This lesson has SKELETON NOTES, notes that have the problem only. I used this with our 1-1
Grades:
7th - 11th
CCSS:
Tetris Transformations with Rotation and Translation Promethean
This is a Tetris transformation game that uses the normal Tetris game and moves to help student understanding of rotation and translation. A great game for students to understand transformations and have lots of fun. It can be used on a Promethean board.
Subjects:
Grades:
10th - 12th

SmartBoard Lesson on Graphing Linear Inequalities
This is an Algebra lesson for the SmartBoard on graphing linear inequalities and systems of linear inequalities. This Notebook file starts with reviewing the inequality symbols and how to graph an inequality on the number line. It then moves on to the definition of a linear inequality and how to graph one on the coordinate plane. The steps to follow are clearly identified and several example problems are provided. The second half of this lesson gives problems about solving systems of linear ineq
Subjects:
Grades:
8th - 12th, Higher Education, Adult Education
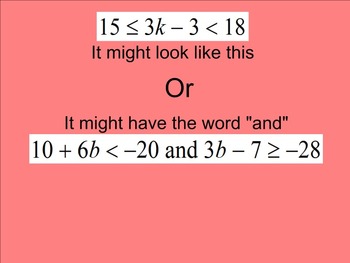
How I Teach Solving & Graphing Compound Inequalities
This is a 41 page Smartboard lesson on how to solve and then graph compound inequalities. The lesson guides you step by step how to solve and graph the "and" type and the "or" type. Plenty of explanation along with an abundance of practice. All practice pages include answers.
Grades:
8th - 11th, Higher Education
Types:
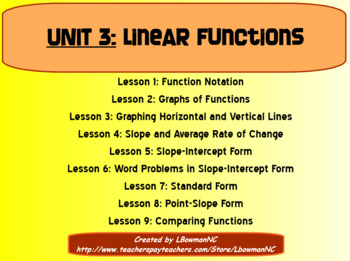
Unit 3-Linear Functions (Math 1)
This is the third of eight Units that I cover in Math 1. This unit is broken up in to nine different lessons that are listed below. Each lesson includes a SMART Notebook presentation with a formative assessment at the end, a student note-taking guide, and an answer key. Also included in this unit is a test review and a 40 question multiple choice and free response test.
BONUS!!! Included in this download are printable "I CAN" Statements and a Lesson Outline for your bulletin board!!!
Unit 3:
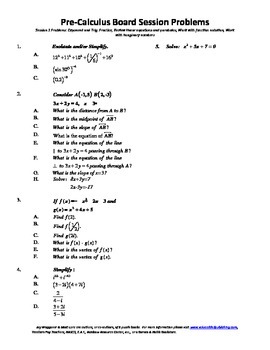
High School Pre-Calculus,Mathematics,Algebra,activities,Combo Package 17
Here’s a package of Pre-Calculus and Algebra II activities bound to please any Pre-Calculus teacher . . . a great present for yourself, or a favorite teacher. The “combo” includes three different forms of activities geared to improving the atmosphere and the testing scores of any Pre-Calculus classroom . . . and it’s priced at a 21% discount from buying the three items separately. Included are: the complete set of Pre-Calculus Board Sessions WITH SOLUTIONS not just answers ($19.95), the complete
Subjects:
Grades:
10th - 12th

CAHSEE Review -- Algebra & Functions
All California public school students must pass the California High School Exit Examination (CAHSEE) in order to receive a high school diploma.
This PowerPoint is used as a review prior to the exam. These are the 40 released questions from the Algebra & Functions section.
Other PowerPoint CAHSEE reviews:
Mathematical Reasoning CAHSEE Review
Number Sense CAHSEE Review
Statistics, Data Analysis & Probability CAHSEE Review
Geometry CAHSEE Review
Algebra 1 CAHSEE Review
Subjects:
Grades:
10th - 11th
Graph Paper 16
This is a free sample of graph paper in Word format. Simply print out the page, or use it onscreen with an interactive whiteboard. This particular graph is 14x14, with subgrids equaling 28x28. It is one of 30 graph papers included in Graphs Grids & Games, a digital document by John Rice available on TeachersPayTeachers.com
Grades:
PreK - 12th, Higher Education, Adult Education
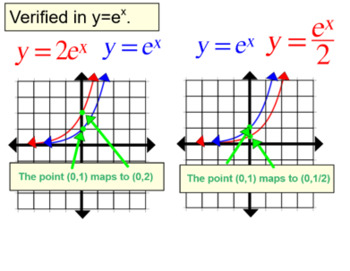
Stretches and Shrinks of Functions, 2 Intro's with 4 assignments for SMART
Update: I added "Transformations Assignment #4 Dilations". This can be printed or used at Teacher Made. This is a link for the student view.Update I added "Graphs of 5 Common Functions Assignment #4" it is available at socrative.comIncluded in this zip folder are 6 SMART Notebook files. 2 are introductory lessons and 4 are assignments. A brief description of each:Intro #1 is a 50 slide file. The emphasis is mapping y=2f(x) back to y=f(x) by replacing y with 2y. Similarly, y=f(2x) is mapped ma
Subjects:
Grades:
8th - 12th
Showing 1-24 of 123 results


