AP Statistics M&M Sampling Distribution Project - Works for Distance Learning!
- PDF
Also included in
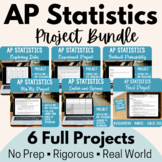
- Looking for some engaging, real-world projects to liven up your AP Statistics course? Need new materials that are ready for remote/ online learning? Want to make sure your AP Statistics course properly prepares student for the AP exam? Look no further - this bundle is for you! In this bundle, you wiPrice $17.10Original Price $19.00Save $1.90
Description
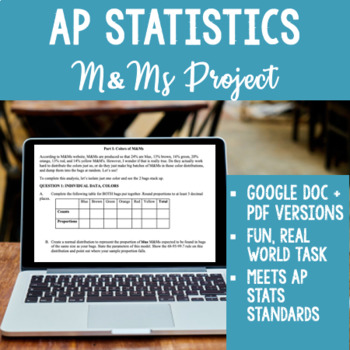
NEW for 2020! This resource now includes both a PDF for printing out a physical copy AND a fully editable Google Doc link for remote or distance learning! Assign the Google doc to your students, and they can type their answers directly into the document and submit their work digitally. They can also create normal curve diagrams in Google Docs using Insert-Image (kids figure out how to do this quite quickly, as I learned this year!)
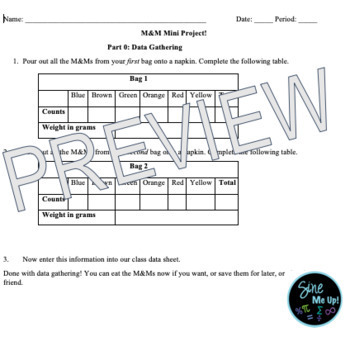
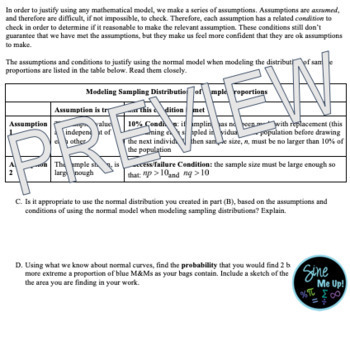
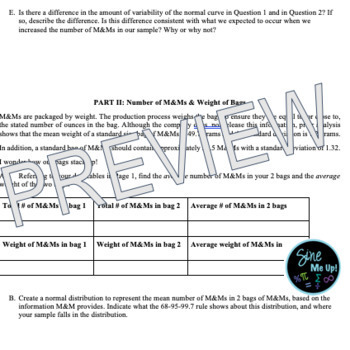
I use this project every year in my AP Statistics class to demystify the often tricky topic of sampling distributions! A great transition between probability and inference. Students analyze 2 bags of M&Ms, weighing the bags using scales I borrow from the science department and calculating the proportion of each color. They then build sampling distribution models around M&Ms published information about both average weights and color distributions, and see where their bags fall. I also have the student post their data to a class list - I do this digitally by making a Google Sheet but you can also do it manually - and then redo the analysis using our aggregate data. This allows students to see the power of a larger sample size.
I tell the students to come to class with two regular bags of M&Ms. However, you could adjust the project to be mini bags if you are purchasing them for your kids. I also reference this data again when I teach them Chi-Square, as the tables of color distributions are perfect for Chi-Square goodness of fit analysis. For my kids, this has been a 2 - 2.5 day (45 minutes periods) project.
I have had great success with this project at the AP level and even have used it with my regular Statistics classes. I hope you and your kids love it too!
Connect with me on Instagram @sinemeupshop and you can see pics of this project in action - and message me with any questions you have about it :)
You may also be interested in my other AP Statistics projects:
Or purchase all 4 at a discounted price in the following bundle: AP Statistics Project Bundle - Includes Digital Versions!

