
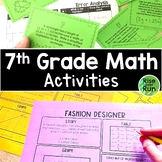
Probability Project Design a Gameshow Game


Rise over Run
23.9k Followers
Grade Levels
7th - 10th
Subjects
Resource Type
Standards
CCSS7.SP.C.5
CCSS7.SP.C.6
CCSS7.SP.C.7
CCSS7.SP.C.7a
CCSS7.SP.C.7b
Formats Included
- PDF
Pages
2 Student Instruction Pages
Rise over Run
23.9k Followers
What educators are saying
Excellent and well planned out resource. Very thorough, this has saved me lots of time!
Fun & engaging way for students to practice in class!
This was a fun activity to use with my group of students who were relearning and applying some prior math
Also included in
 Looking for seventh grade math resources that are engaging, meaningful, standards-based, and help build conceptual understanding? In this big pack are over 50 resources that include hands-on learning, card sorts, games, projects, collaborative group activities, and more! These activities are rigorouPrice $95.00Original Price $145.22Save $50.22
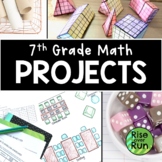 Want to incorporate more PBL in your lessons? Challenge students to use what they have learned in class as they apply 7th grade standards in these real world application and hands-on projects.Included are 6 engaging projects:Rates & Proportional Relationships Business Startup ProjectProbabilityPrice $13.00Original Price $17.50Save $4.50
Description
Look for fun probability activities? Students get creative as they design games for gameshows in this engaging project about simple and compound probability!
Instructions are included to guide students in completing the following:
- Design a game based on a simple event
- Design a game based on a compound event
- Explain the probabilities of winning
- Choose prizes based on a budget and probabilities of winning
The project is split into 2 parts with a rubric for grading each one.
You might provide students some supplies like dice, but they can also can create their own materials for the games they design.
This activity is full of math and engagement. It works great as an individual project, for partners, or for groups. Everyone’s project will turn out differently! You might even decide to play some of the games your students create!
Total Pages
2 Student Instruction Pages
Answer Key
Rubric only
Teaching Duration
2 days
Report this resource to TPT
Reported resources will be reviewed by our team. Report this resource to let us know if this resource violates TPT’s content guidelines.
Standards
to see state-specific standards (only available in the US).
CCSS7.SP.C.5
Understand that the probability of a chance event is a number between 0 and 1 that expresses the likelihood of the event occurring. Larger numbers indicate greater likelihood. A probability near 0 indicates an unlikely event, a probability around 1/2 indicates an event that is neither unlikely nor likely, and a probability near 1 indicates a likely event.
CCSS7.SP.C.6
Approximate the probability of a chance event by collecting data on the chance process that produces it and observing its long-run relative frequency, and predict the approximate relative frequency given the probability. For example, when rolling a number cube 600 times, predict that a 3 or 6 would be rolled roughly 200 times, but probably not exactly 200 times.
CCSS7.SP.C.7
Develop a probability model and use it to find probabilities of events. Compare probabilities from a model to observed frequencies; if the agreement is not good, explain possible sources of the discrepancy.
CCSS7.SP.C.7a
Develop a uniform probability model by assigning equal probability to all outcomes, and use the model to determine probabilities of events. For example, if a student is selected at random from a class, find the probability that Jane will be selected and the probability that a girl will be selected.
CCSS7.SP.C.7b
Develop a probability model (which may not be uniform) by observing frequencies in data generated from a chance process. For example, find the approximate probability that a spinning penny will land heads up or that a tossed paper cup will land open-end down. Do the outcomes for the spinning penny appear to be equally likely based on the observed frequencies?
Reviews
Questions & Answers
23.9k Followers
