246 results
12th grade graphing projects
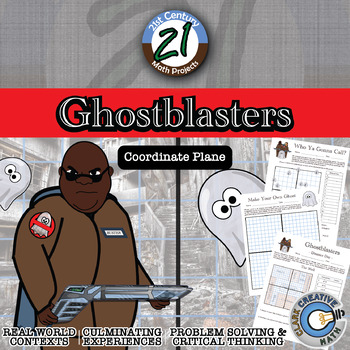
Ghostblasters -- Ordered Pair & Coordinate Plane - 21st Century Math Project
There’s something strange in your neighborhood! Ghosts have managed to escape the capture chamber and have wreaked havoc all over the region. On the case in this 21st Century Math Project is an upstart ghost catching team, the Ghostblasters. Given the ordered pairs on the Ghostblasters radar, find which buildings are infested with ghosts.Blend ordered pair and coordinate plane practice with fun for all!In this 20 page document you will be given a mapping to the Content Standards, an outline for
Grades:
5th - 12th
Types:
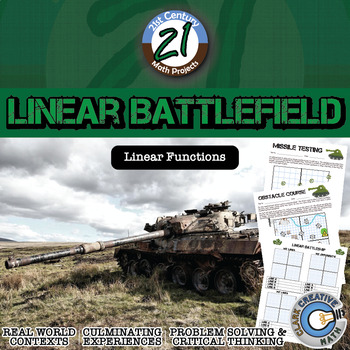
Linear Battlefield -- Graphing Linear Equations - 21st Century Math Project
This is my twist on a popular Algebra game, Linear Battleship. In this 21st Century Math Project, students will work on graphing and reading graphs of linear equations. I've found that students are usually better at graphing the lines than writing the equations of graphed lines. These fun few assignments help reinforce those skills (and even practiced old ordered pairs). The 2-3 day unit will culminate in a Linear Battleship competition which might just turn into a class tournament! In this 9 pa
Grades:
7th - 12th
Types:
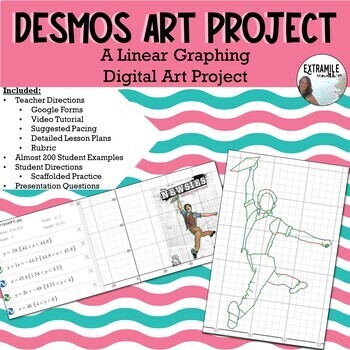
Desmos Art Project- Linear Graphing Project #backtoschool
See this project in action here: 10 Awesome Student Desmos Art Projects (Boomerangs)This project is an excellent way to get to know your students--even from afar!--while they engage in learning and practicing writing linear equations (vertical, horizontal, and slanted lines). The image they choose to "trace" using www.desmos.com is a great way to learn about their passions at the beginning of the year all while reviewing skills from previous years. This is a perfect project for the beginning of
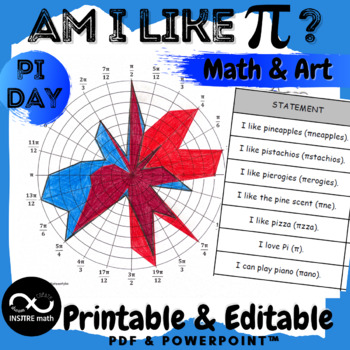
Pi Day Graphing Math Activity | Math & Art Project for Middle or High School
Am I like π? High School Pi Day Activity. This activity can be used in High School, but also in Middle School. It includes a Polar Grid (Polar Coordinates), but students don't need to know it to complete this task.Students graph and connect the points where the indicated line and the circle number that corresponds to each digit of Pi intersect. Then, they read the π-statements and graph points depending on how much they agree with each statement. As a result, they have 2 graphs: Pi and their own
Subjects:
Grades:
6th - 12th
Types:
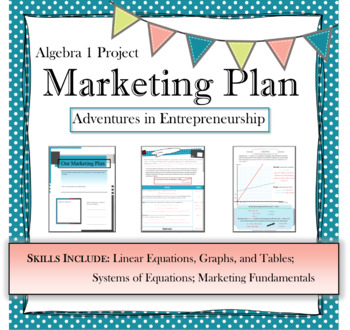
Algebra Marketing Plan PBL | project based learning | real world Math
This Project Based Learning activity will help Algebra 1 students practice setting up and solving systems of linear equations within a real world context. As they take on the role of an entrepreneur, they will write equations, plot coordinate points, graph equations, analyze data, and draw conclusions. This can be used as a group project or individual project and would work great for an end of unit review. ------------------------------------------------------------------------------------------
Subjects:
Grades:
7th - 12th
CCSS:
Also included in: Math Algebra 1 BUNDLE projects, activities, notes, and more

Trig Graphs Roller Coaster Design Project
Students are the creators of a new wild roller coaster made out of trig functions! In this project, students have to incorporate a variety of trig and inverse trig functions into a seamless ride. This project provides practice with graphing trig functions, writing their equations and placing domain restrictions. Included:- Project description and requirements- Two options of suggested graph paper (Students roller coasters usually are long enough that they will need to join 2 pieces of graph pa
Subjects:
Grades:
9th - 12th, Higher Education
Types:
CCSS:
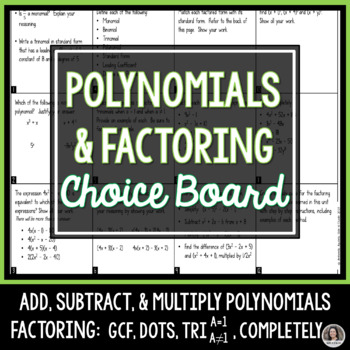
Polynomials and Factoring Choice Board Review Activity Project
This polynomials and factoring math menu or choice board is a perfect assignment for students to practice their skills of the concepts taught within the unit. Students will need to:Define monomial, binomial, trinomial, polynomial, standard form, leading coefficient, and degree of polynomial Add, subtract, and multiply polynomialsFactor GCF, difference of two squares, trinomials a = 1, trinomials a ≠ 1, and factor completelyThis activity goes beyond the worksheet and can be assigned as a review,
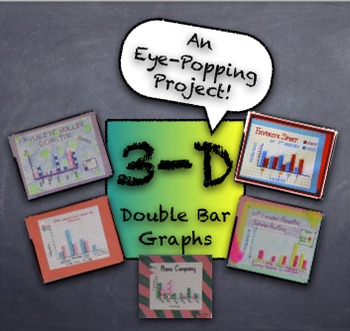
3-D Double Bar Graphs PROJECT from Student Generated Survey Data - Fun Project
This project creates quite an impressive product with simple supplies easily accessible in any classroom. Students generate data from surveys given to peers, using simple questions like, "What's your favorite pizza topping?" Students use survey results to create a 3-dimensional "girls versus boys" double-bar graph. Using centimeter graph paper, markers, and glue sticks, the double-bar graph projects are truly eye-popping! Project description, survey information, and graph assembly instructio
Subjects:
Grades:
3rd - 12th, Adult Education
Types:
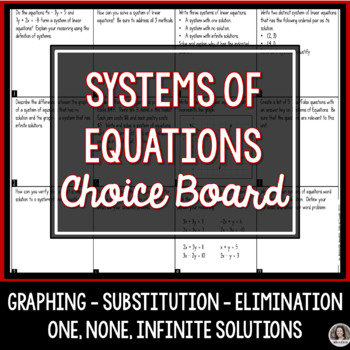
Systems of Equations Choice Board Review Activity Project
This systems of linear equations math menu or choice board is a perfect assignment for students to practice their skills of the concepts taught within the unit. Students will need to:Find a solution to a system graphically Find a solution to a system algebraically by substitution or eliminationUnderstand the number of solutions to a system of equationsUnderstand which method is the most appropriateWrite a system of equationsThis activity goes beyond the worksheet and can be assigned as a review,
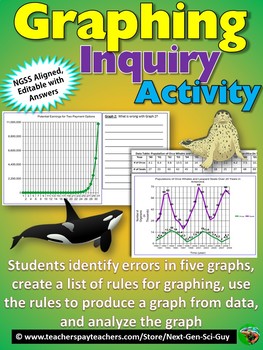
Graphing Inquiry Activity: NGSS Graphing and Data Analysis: Distance Learning
This activity proceeds as follows:1. Students are given a hypothetical scenario in which they are offered two different payment options for house-sitting a wealthy neighbor's house, and have to fill in a data table by calculating the earnings for each option 2. Students then evaluate five different graphs, each of which incorrectly represents the data in some way. They must find the mistakes.3. Students then generate a list of rules for proper graphing4. Students use their rules, and data on or
Grades:
7th - 12th
Types:
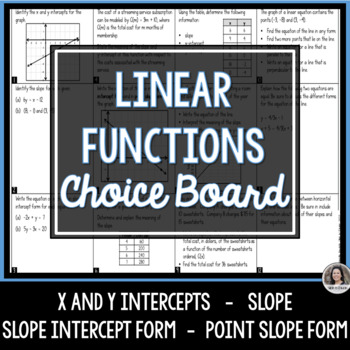
Linear Functions Choice Board Review Activity Project
This linear functions math menu or choice board is a perfect assignment for students to practice their skills of the concepts taught within the unit.finding and interpreting x and y interceptsfinding and interpreting slopewriting the equation of the line in slope intercept form and point slope form given points, a graph, or a word problemexplaining the difference between vertical and horizontal linesThis activity goes beyond the worksheet and can be assigned as a review, a project, or a formal a
Radical Function Applications - Real World Tasks
This activity contains 4 real-world applications of radical functions (both square root and nth root). Students can take on the role of a financial planner, a doctor, a scientist, and a business-person as they interact with radical equations and graphs. These tasks do require students to use Desmos or a graphing calculator for some of the graphing. Answer key is provided.
Subjects:
Grades:
9th - 12th
Types:
CCSS:
March Madness Math Statistics Activity
Students will choose their own team in the March Madness tournament and find the data landmarks for the points that team scored throughout the year. Students will also be asked to create a histogram using the points the team scored throughout the year.
*One modification - If you prefer you can give your students a few teams to pick from instead of allowing them to choose ANY team.
Subjects:
Grades:
5th - 12th
Types:
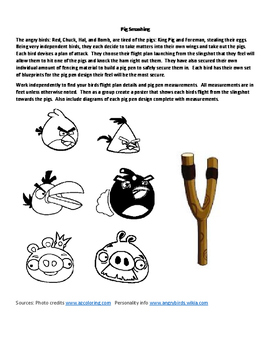
Angry Birds Optimization and Projectile Motion Group Project
This is a group project designed for 4 students. In this project, students work independently to determine certain information about their own angry bird and his plan. Topics covered include: Optimization, Dimensional Analysis, Quadratics, Projectile Motion, and more. Then the group comes together to compare results and determine the best plan of action for successfully stopping the pigs. Below is a brief outline of the scenario, what is asked for one student, and what is asked from the grou
Subjects:
Grades:
10th - 12th, Higher Education
Types:
Graphing Functions Stained Glass Art Bundle
This is an expanding bundle! These cross-curricular projects each focus on a different function. Once you buy the bundle you will have access to all of them!linearquadraticexponentiallogarithmicabsolute valueStudents will deepen their understanding of transforming those functions while creating beautiful art. Great for bulletin boards! Answer keys and extension ideas provided.
Grades:
8th - 12th
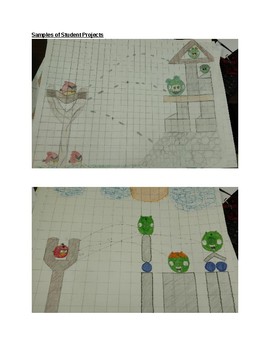
Angry Birds - Quadratic Equations Poster Project
I wanted to find a project involving quadratic functions that would fully engage my students and I immediately thought of the game Angry Birds. I looked around on the internet and found some activities but no projects that fit what I wanted. I wanted it to be similar to how the game works, involve an appropriate and manageable level of difficulty and be open enough that each student should have a unique design. So when you can’t find it, design it.
The goal of this project is to design an Angr
Subjects:
Grades:
9th - 12th
Types:
CCSS:
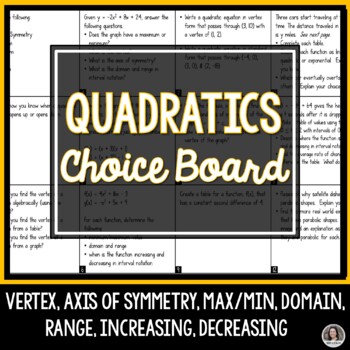
Quadratics Choice Board Review Activity Project
This quadratics math menu or choice board is a perfect assignment for students to practice their skills of the concepts taught within the unit. Students will need to:define vertex, axis of symmetry, minimum, maximum, zeros, and paraboladetermine vertex, axis of symmetry, domain, range, increasing, and decreasing given a functiondetermine the quadratic function given pointsunderstand standard form, vertex form and x-intercept formunderstand how “c” affect y=ax2create a table of value that has a c

Scatter Plot and Bivariate Data Research Project
Students will begin a statistics project on one of their favorite restaurants or food chains! They will be researching nutrition facts and surveying others on what types of food they like to eat there. Through this data collection they will work on their skills of creating scatter plot graphs, creating relative frequency tables, and analyzing this data. This can be used either by paper or digitally. I used it the last two years during distance learning. Rubric included.
Subjects:
Grades:
7th - 12th
Types:
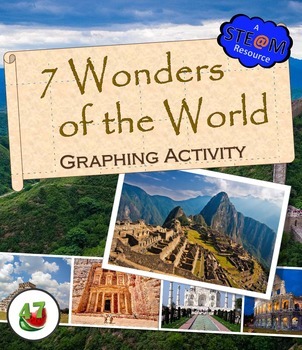
7 Wonders of the World: STEAM Graphing Activity
The 7 Wonders of the World graphing activities are differentiated exercises for excelling students that combine coordinate graphing with art and geography. In addition, the enrichment questions encourage students to investigate the concepts of perspective, slope, shading, and symmetry.
(For ease of graphing, Machu Picchu has been traded for another great wonder of the world, the Great Pyramid.)
These are great activities for students who understand the basics of plotting points on a coordinat
Subjects:
Grades:
8th - 12th
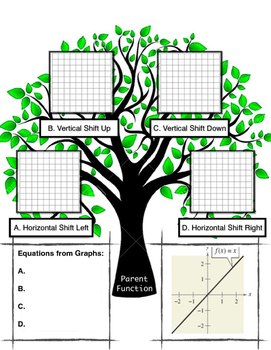
Function Transformation Family Tree
Looking at complex functions can be scary, but understanding where they come from and how they relate to each other can help!
Using common parent functions, students will practice function transformations, specifically shifting, by both graphing and writing equations. The concept of a "family tree" is used to show students that functions can be related, but also unique individuals.
Given a graph of the original function, students will draw four "family members" or transformations: shift up,
Subjects:
Grades:
9th - 12th
Types:
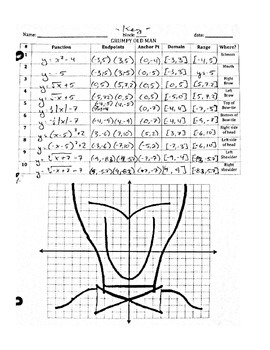
Function Transformation: Grumpy Old Man
Students must create functions based off commands. When they are graphed together (on paper and on a graphing calculator) they create an image of a grumpy old man. I use this activity before I have the students create their own image on Desmos.com. They say it is really helpful for them.
Practices:
- Function transformation with linear, absolute value, quadratic, square root, cubic, and cubed root functions.
- Finding domain and range.
- Finding key/anchor points.
- Graphing with restricted
Subjects:
Grades:
10th - 12th
Types:
CCSS:
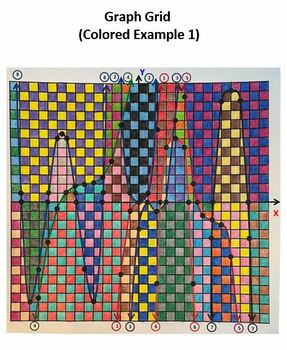
Cubic and Quartic Polynomial Functions Calculation and Graphing Project
PLEASE NOTE: THE PREVIEW VERSION OF THIS PRODUCT IS THE ACTUAL "STUDENT VERSION" AND DOES NOT INCLUDE ANY OF THE ANSWERS TO THE PROBLEMS. THE "TEACHER VERSION" INCLUDES DETAILED ANSWERS TO ALL OF THE PROBLEMS FOR THE PROJECT. This project involves the calculation, graphing and coloring of cubic and quartic polynomial functions which are typically studied in Algebra 2/Math 3 and Pre-Calculus. I have my Algebra 2, Math 3 and Precalculus students complete this project toward the end of the unit o
Subjects:
Grades:
10th - 12th
Types:
CCSS:
Functions Choice Board Review Activity Project
This functions math menu or choice board is a perfect assignment for students to practice their skills of the concepts taught within the unit. Students will need to:find domain and rangeunderstand function notationevaluate functions from equations, tables, and graphscompare functions from equations, tables, and graphsThis activity goes beyond the worksheet and can be assigned as a review, a project, or a formal assessment. Most classrooms are filled with students of varying academic abilities. B
Thanksgiving Statistics and Probability Task Project
With a Thanksgiving theme, students are required to create various graphs to display data. Students are asked to create a stem-and-leaf graph, frequency table, line plot, and box-and whisker graph. Students also have the option to create a circle graph.
Subjects:
Grades:
5th - 12th
Types:
Showing 1-24 of 246 results


