22 results
12th grade graphing research
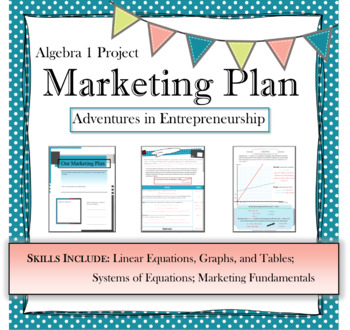
Algebra Marketing Plan PBL | project based learning | real world Math
This Project Based Learning activity will help Algebra 1 students practice setting up and solving systems of linear equations within a real world context. As they take on the role of an entrepreneur, they will write equations, plot coordinate points, graph equations, analyze data, and draw conclusions. This can be used as a group project or individual project and would work great for an end of unit review. ------------------------------------------------------------------------------------------
Subjects:
Grades:
7th - 12th
CCSS:
Also included in: Math Algebra 1 BUNDLE projects, activities, notes, and more

Scatter Plot and Bivariate Data Research Project
Students will begin a statistics project on one of their favorite restaurants or food chains! They will be researching nutrition facts and surveying others on what types of food they like to eat there. Through this data collection they will work on their skills of creating scatter plot graphs, creating relative frequency tables, and analyzing this data. This can be used either by paper or digitally. I used it the last two years during distance learning. Rubric included.
Subjects:
Grades:
7th - 12th
Types:
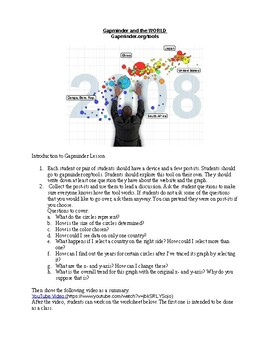
Gapminder and the World Activity
Students use gapminder.org/tools to discover the relationships between various historical factors and the population of many countries over time. This lesson connects history with linear relationships. It is a great way to add context to graphs and help students apply their math knowledge in a unique cross-content way.
Subjects:
Grades:
8th - 12th
Types:
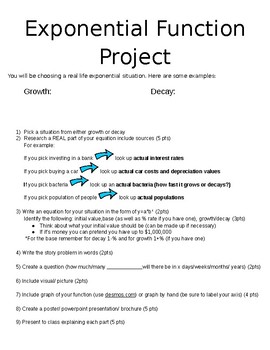
Exponential Function Real Life Project
Students pick an exponential growth or decay situation and research real life rates or values. Furthermore, they create an equation, write a story problem, ask and answer a question, create a graph and present a powerpoint or poster about their exponential situation.
* Note blank space under growth and decay is meant for a whole class brainstorm about the different scenarios they can think of.
Subjects:
Grades:
8th - 12th
Family Album Project
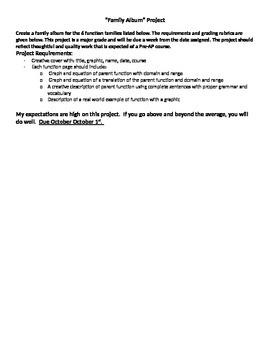
A project designed to summarize the transformations, characteristics, and domain and range of the parent functions. Allows students to be creative.
Subjects:
Grades:
9th - 12th
Types:
Introduction to Sharks, Skates and Rays
Biology, Marine Biology, Upper Level Elementary ScienceIncluded in the package:- Introduction to Sharks Powerpoint (41 slides)- Shark Anatomy Powerpoint (46 slides)- Cartilaginous Fish (Rays & Skates) (44 slides)- Shark Game Show (Jeopardy style) Review PowerpointTo assess:- Shark Test- Shark Test Study Guide- Shark Test Study Guide ANSWERS- Cartilaginous Fish Quiz - Cartilaginous Fish Quiz ANSWERSStudents Research and Activities:- Shark Species Internet Research Questions- Shark Species Pre
North Carolina Lighthouses Map and Bar Graph
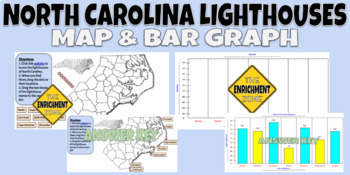
North Carolina's lighthouses are some of the most famous in the world. There are 7 standing lighthouses along the coast of NC and many students may never see them in person. In this resource, students will be able to research where those lighthouses are and how tall they are. What's included:1. Blank map of NC coast and directions for students to go to a website and locate the lighthouses, then come back to the Google Slides and drag the circles/names to the correct location.2. Blank bar graph
Grades:
3rd - 12th
Types:
6 Editable Bar Graph Templates 2.0
Finally a simple and professional graph space that students can fill out without any design issues getting in the way. This file contains 6 ready-to-use graph options. Print them and have students fill them with pencil and ruler, or distribute them over computer and let them practice entering the data. Get a project perfect finish every time. Maybe you just want to fill it out live on a projector? The possibilities are endless! It's okay to say you love these bar graphs. So do we.Contains:- 2 bl
![Preview of Magic School Bus Rides Again *Assessment Package* [Episode 1: INVASIVE SPECIES]](https://ecdn.teacherspayteachers.com/thumbitem/Magic-School-Bus-Rides-Again-Assessment-Package-Episode-1-INVASIVE-SPECIES--3429473-1507989908/original-3429473-1.jpg)
Magic School Bus Rides Again *Assessment Package* [Episode 1: INVASIVE SPECIES]
The Magic School Bus Rides Again
Episode 1 – Frizzle of the Future
Topic: Invasive Species
Assessment Package Includes:
• Teacher’s Guide
• Answer Key
• Student Video Packet:
★ Part 1: Video Assessment
→ Episode Overview to engage students.
→ Pre-Viewing Questions to elicit prior knowledge, preconceptions, and misconceptions.
→ Viewing Questions for students to answer while watching the episode.
★ Part 2: Graphing & Analyzing Data
→ Student
Subjects:
Grades:
7th - 12th
Types:
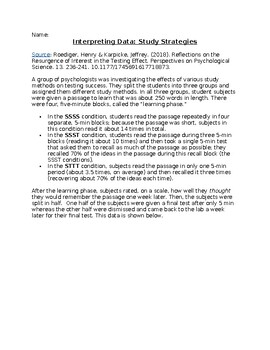
Teach study skills through graphical analysis
Have your students come to their own conclusions about the benefits of retesting over rereading by having them analyze this graph from a 2018 psychology paper. They can practice identifying variables while they compare results, interpret error bars, and apply it to their own study methods.
Subjects:
Grades:
7th - 12th
Types:
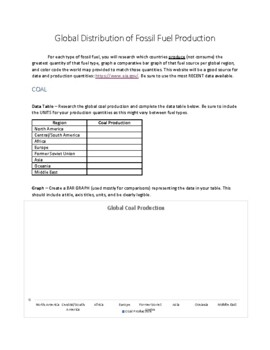
Global Distribution of Fossil Fuels - AP Environmental Science
This worksheet has students researching, graphing, and drawing conclusions about the global distribution of fossil fuel production. For each type of fossil fuel, students will research which countries produce (not consume) the greatest quantity of that fuel type, graph a comparative bar graph of that fuel source per global region, and color code the world map provided to match those quantities.
Subjects:
Grades:
11th - 12th
Types:
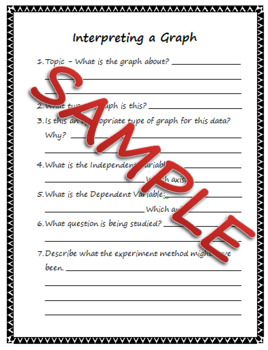
Interpreting a Graph Worksheet
I used this 2-page worksheet with my high school students to interpret graphs and visual data. It goes through all parts of the graph, and asks students to interpret data and trends in the data. Students are asked to describe the scientific method might have been gathered. Students are then asked about implications of the data and how the data might have been used.You will receive a 2-page PDF. If you have any questions - I'd prefer you ask me BEFORE purchasing rather than leaving less than fl
Subjects:
Grades:
7th - 12th
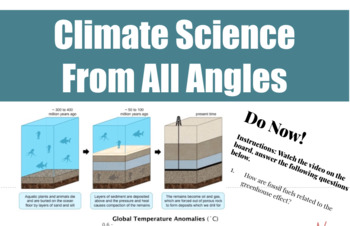
Climate Science From All Angles
Great for remote instruction! Bring your Earth science students' active knowledge of climate to a whole new level with multi-modal activities in "Climate Science from All Angles." These sequenced approaches to building scientific-literacy incorporate current news, graphing, argumentation, and scaffolded methods for writing scientific explanations. Where Science and Literacy Meet! learnmore@stemjourneys.org.
Subjects:
Grades:
5th - 12th, Higher Education, Adult Education, Staff, Not Grade Specific
Types:
CCSS:
NGSS:
MS-ESS3-2
, MS-ESS3-5
, MS-ESS3-3
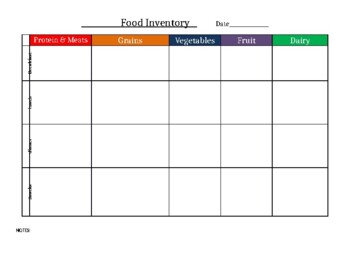
Food Inventory Daily Food and Nutrition Chart/Tracker
Food Inventory Daily Food and Nutrition Chart/TrackerSee preview for setup!
Subjects:
Grades:
PreK - 12th
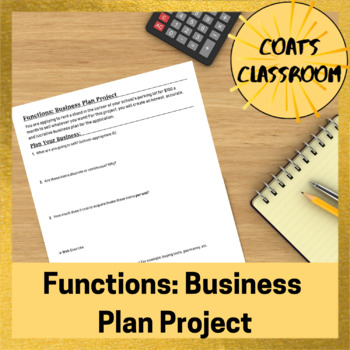
Functions Business Plan Project - Editable
A fun application project to connect writing functions to the real world! Students will create a business plan to sell items from a rented stand. They will consider prices per unit, selling price, upfront costs, rent, and more. Students will write a function that encompasses all costs, then find the point where they break even and create a graph. Rubric is included, along with a feedback worksheet for students to complete while their classmates are presenting. Check out the preview for a full vi
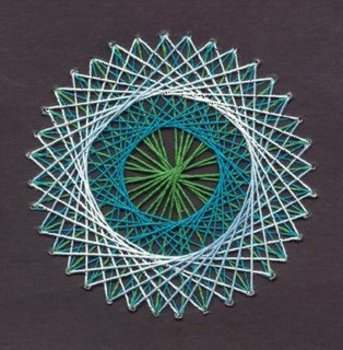
IB-Extended Essay Suggestion: The Mathematics of String Art
This document provides ideas for an extended essay investigation into the maths of string art. Ideal for International Baccalaureate Extended Essays
U.S. States and their Demographics (based on 2010 U.S. Census)
This 50 page resource (PDF) contains census information for each of our fifty (50) states. Now, your students can use official 2010 U.S. Census population numbers (U.S. Census Bureau) for their research, analysis, and/or project creation.
Included in this resource are the following:
State Demographics (state population totals of each of our fifty (50) states by sex, by age groups, by ethnicity, and by race)
This resource can be used for the following:
drawing evidence from literary or informa
Grades:
3rd - 12th
Types:
![Preview of Magic School Bus Rides Again *Assessment Package* [Episode 6: ALLERGIES]](https://ecdn.teacherspayteachers.com/thumbitem/Magic-School-Bus-Rides-Again-Assessment-Package-Episode-6-ALLERGIES--3430289-1507989939/original-3430289-1.jpg)
Magic School Bus Rides Again *Assessment Package* [Episode 6: ALLERGIES]
The Magic School Bus Rides Again
Episode 6 – Carlos Gets the Sneezes
Topic: Allergies
Assessment Package Includes:
• Teacher’s Guide
• Answer Key
• Student Video Packet:
★ Part 1: Video Assessment
→ Episode Overview to engage students.
→ Pre-Viewing Questions to elicit prior knowledge, preconceptions, and misconceptions.
→ Viewing Questions for students to answer while watching the episode.
★ Part 2: Graphing & Analyzing Data
→ Students wil
Subjects:
Grades:
7th - 12th
Types:
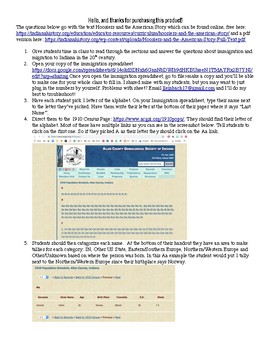
Immigration and Migration in IN | Indiana Studies | Indiana History
Students will read, answer questions and create charts from census data to learn about immigration and migration patterns in Indiana in the 20th century. StandardsIS.1.9 Explain key ideas, movements, and inventions and summarize their impact on rural and urban communities throughout Indiana. IS.1.10 Summarize the impact immigration had on social movements of the era including the contributions specific individuals and groups.Complete Indiana Studies Bundle: https://www.teacherspayteachers.com/Pr
Grades:
9th - 12th
Also included in: Indiana Studies Complete Bundle
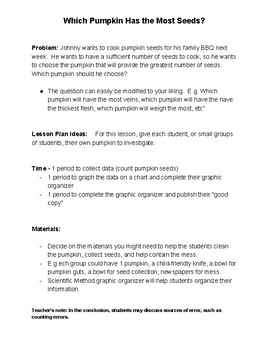
Investigating Pumpkins (Halloween) - Data Management/Science Activity
This is an easy science activity which helps introduce or refine scientific method skills for students.I have used this activity during several Halloween days, fall activities, and when introducing the scientific method.High school teachers can easily adjust the lesson to suit their own expectations.I have included a simple graphic organizer that can be used for any science experiment.Enjoy!
Subjects:
Grades:
1st - 12th
Types:

Duckweed Independent vs Dependent Growth Experiment and Paper
This is a fun lab experiment that I do with my sophomore biology students during our ecology unit. The students each have their own samples of duckweed (Lemna minor) and collect data over 2-3 weeks. They write a scientific paper afterwards. I have included basic lab instructions, student paper instructions, a spreadsheet that the students can put their collected data into, and a grading rubric. Edit the documents as needed for your class.
Grades:
10th - 12th, Higher Education
Types:
NGSS:
HS-LS2-1
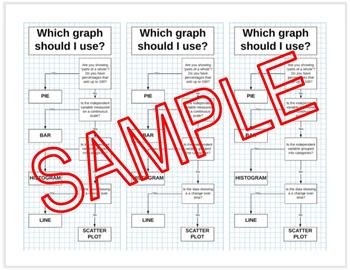
WHICH GRAPH SHOULD I USE? - Graphing - Math - Science - Interactive Notebook
Have trouble teaching students which graph is appropriate? This is the resource for you.
As you can see from the preview the branching tree walks students through 4 simple questions that will lead them to the correct graph. Graphs included in the resource are; bar, line, scatter plot, histogram, and pie chart. This PDF is formatted to print 3 slips er 8 1/2 by 11 page. These are the perfect size for bookmarks or for interactive notebooks.
Showing 1-22 of 22 results


