622 results
12th grade graphing assessments

Beaker Pong: Experimental Design and Graphing Lab, NGSS aligned
Great 1st week or 1st month STEM activity! All parts are EDITABLE and includes a graphing grid! This is a great way to introduce the "science process" (better phrase for scientific method) at the start of a semester or anytime you want fun to occur in your classroom.*****Focus on the NGSS PRACTICES Dimension*****The National Research Council's (NRC) Framework describes a vision of what it means to be proficient in science; it rests on a view of science as both a body of knowledge and an evidenc
Subjects:
Grades:
7th - 12th
Types:
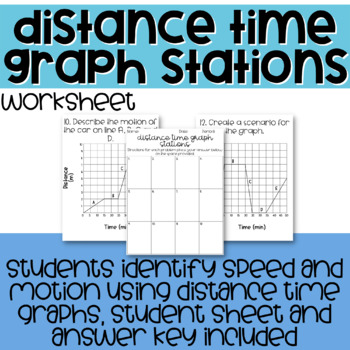
Distance Time Graphs Stations
In this station activity students will be identifying and describing the motion of objects by using a distance / time graph. Students will also use distance / time graphs to determine the speed of an object. This download includes 12 distance / time graph problems for students to complete. This activity is aligned with science TEKS 6.8 C, and TEKS 6.8 D.
Subjects:
Grades:
5th - 12th
Types:
Also included in: Force and Motion Growing Bundle
ACT Math Test Prep for Algebra Geometry Number Sense
This ACT math resource has 26 questions covering the following topics: functions, algebraic and geometric transformations, graphing, exponent rules, slope, midpoint, quadratic formula, geometric sequences and more! The answer key comes with explanations for each problem! Standards are included so student can determine weaknesses. If you want a combination of SAT, PSAT, ACT and ACCUPLACER and TSI, then check out the Mega Bundle below:COLLEGE TEST PREP MEGA BUNDLE - 3 BUNDLES IN ONE!Copyright © Ti
Grades:
9th - 12th, Higher Education, Adult Education
Types:
Also included in: ACT Math Test Prep Bundle
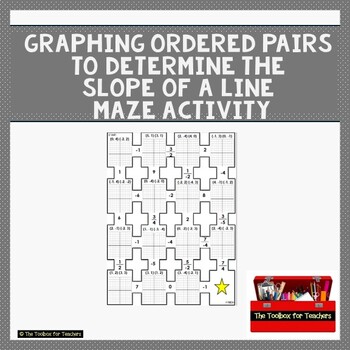
Linear Equations Graph Points Rise Over Run Slope Rate of Change Maze Algebra
Linear Equations Graph Points Rise Over Run Slope Rate of Change Maze AlgebraMy students absolutely love maze worksheets. Maze worksheets are a fun alternative to traditional worksheets while still targeting the essential skills. This is a PDF file that involves plotting sets of points and then determining the Rise over Run/ Slope/ Rate of Change from the graphed points. The objective is to correctly graph the sets of points then determine the slope of the graph. Once the student has determined
Subjects:
Grades:
9th - 12th
Types:
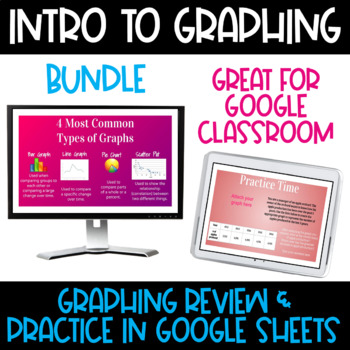
Google Classroom Interactive Slides: Intro to Graphing Bundle
Ain't Nobody Got Time to Graph! This Google Classroom resource is a great way to introduce graphing to your students in an easy step-by-step process! This product includes two of my graphing products bundled together for a 13% discount off the total price! In this interactive Google Classroom resource, students will learn about four types of graphs (bar graphs, line graphs, pie charts and scatter plots) as well as when to use each type of graph and how to create each type of graph using Google
Grades:
5th - 12th
Types:
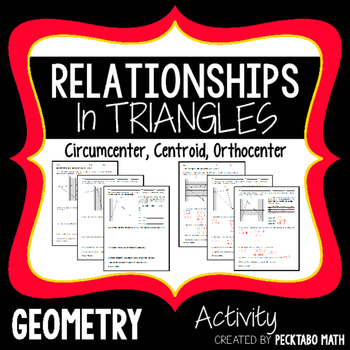
Relationships In Triangles Activity GEOMETRY Circumcenter, Centroid, Orthocenter
This activity has the students find the circumcenter, centroid, and orthocenter of a triangle Algebraically and then compare to the graph. Most problems do not have a lattice point as the answer which forces the students to use algebra to solve. It is a guided activity.
There are 4 versions of this activity. Each version has 3 pages. One page for each center.
The answer keys are detailed with the work for solving the systems.
*******************************************************************
Grades:
7th - 12th
Types:

Exponential Functions ALGEBRA Bundle
Exponential Functions BUNDLEThis bundle contains all of my exponential function products.Products contained in this bundle:-An exploration of Exponential functions-Graphing Exponential Functions Practice WORKSHEET-Graphing Exponential Functions Practice #2 WORKSHEET-Exponential Functions Identify, Write, and Graph WORKSHEET-Compound Interest Review + Practice REVIEW WORKSHEET-Exponential Growth and Decay Review + Practice REVIEW WORKSHEET-Exponential Functions Skills Checks SKILLS CHECK BUNDLE-E
Subjects:
Grades:
6th - 12th
Types:
CCSS:

Trig Graphs Roller Coaster Design Project
Students are the creators of a new wild roller coaster made out of trig functions! In this project, students have to incorporate a variety of trig and inverse trig functions into a seamless ride. This project provides practice with graphing trig functions, writing their equations and placing domain restrictions. Included:- Project description and requirements- Two options of suggested graph paper (Students roller coasters usually are long enough that they will need to join 2 pieces of graph pa
Subjects:
Grades:
9th - 12th, Higher Education
Types:
CCSS:
Task Cards: Slopes of Parallel and Perpendicular Lines
These 30 task cards include three types of questions about slopes of parallel and perpendicular lines. The three types of questions help make differentiation easy and are denoted by different border styles. Please see preview for samples. Ten of each type of question are included. Answer key and student recording sheet are included.This set is also available as part of a larger full lesson pack:Lesson Pack: Slopes of Parallel and Perpendicular LinesThis set of cards can be used in many ways.
Grades:
8th - 12th
Types:
CCSS:

Leadership & Data Notebook with Graphs, Conferences, Goals & More - UPDATED
UPDATED - Now with 34 pages of Leadership and Data Tools and Pages for Notebooks!
Such a key tool for tracking progress, setting goals, holding students accountable, student-led conferencing, parent communication and more!
Includes:
Cover Sheet
5 Tabs Suggestions: Goals, Data, Leadership Roles, Victories, Conferences
Developing a Class Mission Statement Guides
Setting, Planning and Tracking Personal Goals
Setting, Planning and Tracking Academic Goals
Reviewing Goals
Data Graphs for Successmak
Grades:
K - 12th, Staff
Types:
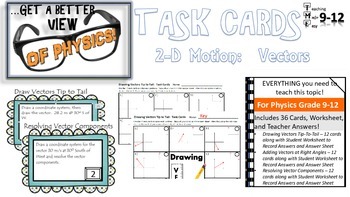
Physics Task Cards 2-D Vectors
2-D Vector Task Cards provides a great way for students to be actively involved in the learning process. Students can work in cooperative teams or solve problems individually. To formally assess student progress, students can present selected task cards to conserve classroom time. Physics Standards:This hits standards for 1.) Drawing Vectors 2.) Calculating Magnitude and Direction at Right Angles3.) Calculating Resultant Vectors4.) Resolving Vectors into X and Y Components2-D Vector Task Card
Subjects:
Grades:
9th - 12th
Types:
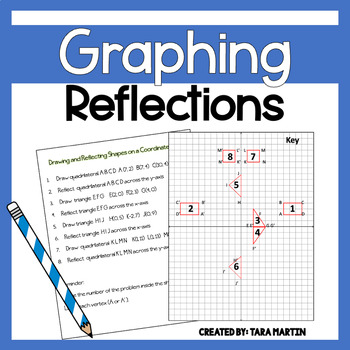
Graphing Reflections, Transformations in Math
Graphing Transformations: ReflectionsLooking for extra practice on drawing and reflecting shapes on a coordinate plane? Then, you've found the right place! This worksheet gives students coordinates for shapes and instructions on which axis to reflect them across. Included:~Instruction Sheet~Graph Paper~Accommodated Graph Paper (can be used for those that need extra assistance graphing the original shapes or for the entire class as a time saver)~KeyYou may also like...Graphing Translations
Grades:
5th - 12th
Types:
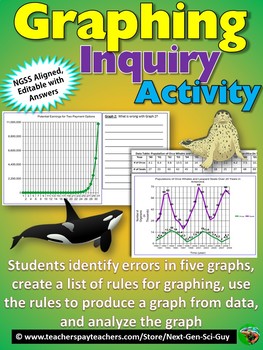
Graphing Inquiry Activity: NGSS Graphing and Data Analysis: Distance Learning
This activity proceeds as follows:1. Students are given a hypothetical scenario in which they are offered two different payment options for house-sitting a wealthy neighbor's house, and have to fill in a data table by calculating the earnings for each option 2. Students then evaluate five different graphs, each of which incorrectly represents the data in some way. They must find the mistakes.3. Students then generate a list of rules for proper graphing4. Students use their rules, and data on or
Grades:
7th - 12th
Types:
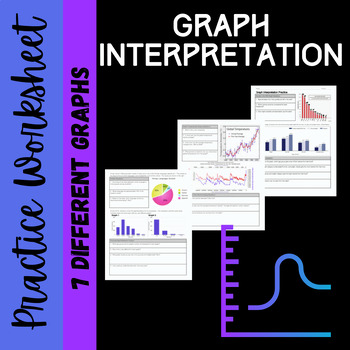
Graph Interpretation Practice
I created this worksheet as a review for students entering my science classes after a long summer of taking selfies. It also helps me assess their incoming knowledge and determine if they need more practice. Students are asked to analyze and interpret data for 7 graphs (line, bar and pie). I have uploaded this in a .docx format so you can modify and differentiate the questions to meet your students' and classroom needs. ANSWER KEY IS INCLUDED. Enjoy!
Subjects:
Grades:
8th - 12th
Types:
Also included in: Science Basic Principles Review Bundle
12 Biology Graph Prompts- WITH key
I teach in WI and we have to create an SLO for Educator Effectiveness each year. For the last few school years, my SLO has been as follows (and feel free to use it if it works for you!!)-- "By the end of the __ school year, 90% of students will get a 8 or better on the 10-point graph grading rubric." I give a graph prompt to my students for almost every unit; they take students anywhere between 5-20 minutes to complete. They get a bit harder as they go. In this bundle, you get the 12 graph promp
Grades:
9th - 12th
Types:
Also included in: The BIG Biology Bundle!
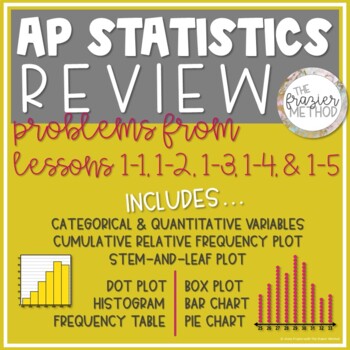
AP Statistics Review - Histogram, Box Plot, Stem-and-Leaf, Bar Graph, Pie Chart
REVIEW OF 1-1, 1-2, 1-3, 1-4, & 1-5 (1 Page, Front & Back)ANSWER KEY INCLUDEDProblems align with The Frazier Method’s Notes from Unit 1: Exploring One-Variable Data:Lesson 1-1: Categorical & Quantitative VariablesLesson 1-2: Displaying 1 Categorical Variable – Frequency Table, Bar Graph, Pie ChartLesson 1-3: Displaying 1 Quantitative Variable Part 1 – Dot Plot, Stem-and-Leaf Plot, HistogramLesson 1-4: Displaying 1 Quantitative Variable Part 2 – Cumulative Relative Frequency PlotLesso
Subjects:
Grades:
9th - 12th
Types:
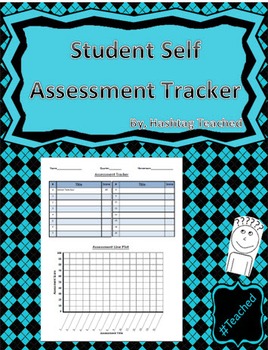
Student Assessment Tracker Template
Aligned with programs like Leader in Me where students take ownership over their own learning as well as the researched supported by John Hatties, there is an increase in achievement when students understand where they are in the learning process. This awesome tracker allows students to track their own assessment results in a table and then plot it onto a line plot. Students will improve in proficiency with data analysis, graphing as well as take ownership over their growth!
Students can use th
Grades:
2nd - 12th
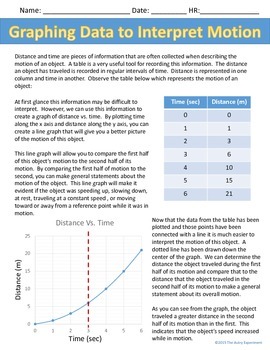
Graphing: Distance vs. Time Graphs: Creating Distance vs. Time Graphs 5.P.1.3
Students will use given distance and time data to create distance vs. time graphs and illustrate the motion of an object. Students must accurately plot the data given and then accurately describe the motion of the object.
This activity is differentiated. Students may either write their own descriptions from the graphs they create, or they can select a description from the choices provided and cut and paste it in to place.
This is a great way to apply mathematics concepts and force and moti
Grades:
4th - 12th
Types:
Graphing Activity Bundle NGSS Cross Cutting Concepts SEP Bar Line Worksheets
Boost Your Science Curriculum with Engaging Graphing Lessons - NGSS Aligned! Looking for a comprehensive resource to enhance your students' understanding of graphs while targeting NGSS Science and Engineering Practices and Crosscutting Concepts? Look no further! This bundle is the perfect fit for your classroom needs.With over 10 resources and counting, this bundle provides a wide range of lessons that can be utilized as scaffolds, reviews, warm-ups, bell ringers, sub plans, or assessments. Whet
Subjects:
Grades:
6th - 12th

Science Basic Principles Review Bundle
I use these worksheets as a review for students entering my science classroom in August. This can also serve as a formative assessment for these basic skills needed to be successful in a science classroom. All of the materials included in this bundle are sold separately on TpT. Click on the links above to see detailed descriptions of each product included. Enjoy!
Subjects:
Grades:
7th - 12th
Types:

Angry Birds Optimization and Projectile Motion Group Project
This is a group project designed for 4 students. In this project, students work independently to determine certain information about their own angry bird and his plan. Topics covered include: Optimization, Dimensional Analysis, Quadratics, Projectile Motion, and more. Then the group comes together to compare results and determine the best plan of action for successfully stopping the pigs. Below is a brief outline of the scenario, what is asked for one student, and what is asked from the grou
Subjects:
Grades:
10th - 12th, Higher Education
Types:
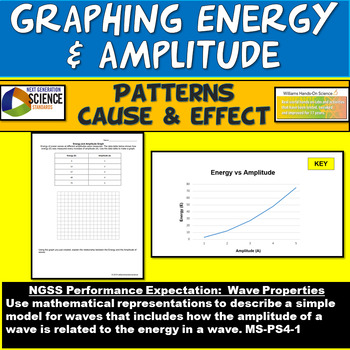
NGSS MS-PS4-1 Graphing Energy & Amplitude Worksheet & PowerPoint
If you are teaching your students how to understand graphs and how the amplitude of a wave is related to the energy in a wave (NGSS Performance Expectation MS-PS4-1), this resource is a great scaffold or assessment! Students discover that as the amplitude of a wave increases the energy increases exponentially, meaning that a small increase in amplitude causes a larger increase in energy. This resource is great as a warm up/bell ringer, homework or sub plan.Take a look at these two graphing waves
Subjects:
Grades:
6th - 12th
NGSS:
MS-PS4-1
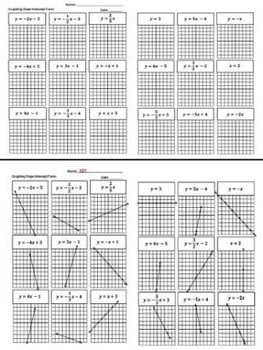
Graphing Slope Intercept Form Linear Equations Worksheet Quiz Review
Graphing Slope Intercept Form Linear Equations Worksheet Quiz Review
This is a 2 page PDF document that assesses a student’s ability to graph slope intercept form equations.
The assignment includes (18) equations and graphs.
The answer key is included.
Need more Linear Equations Resources? Check out these items available in my TpT Store.
4 Types of Slope Foldable
Equations of Lines Foldable
Linear Equations Quiz
Slope Intercept Foldable
Calculate Slope Foldable
Parallel Perpendicular
Subjects:
Grades:
6th - 12th, Adult Education
Types:

Linear Vs Exponential Functions Walk Around or Gallery Walk with a Riddle
This walk around activity is amazing. It keeps ALL students engaged, having fun, while being assessed all at the same time. Students start at any problem and locate the answer on another page which includes a letter which will spell out a riddle at the end. Check out the preview page and how it leads you to the next problem. Don’t worry, detailed instructions are provided.
Out of all the activities I do in the classroom, this is my favorite thing to do. My students get excited when they
Grades:
8th - 12th
Types:
Also included in: Algebra I Math Bundle of Walk Arounds or Gallery Walks with Riddles
Showing 1-24 of 622 results


