524 results
3rd grade graphing projects
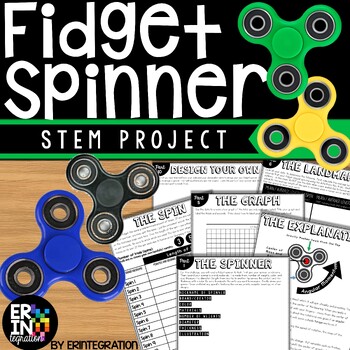
Fidget Spinner STEM Challenge Activities and Science Experiment
The ORIGINAL Fidget Spinner Stem Challenge & Science Lab! Discover the science of fidget spinners with this engaging and low-prep STEM activity. Practice scientific method with an exploration of variables, data collection, graphing, mean/average, and more...all while having fun!This self-paced, fidget spinner activity is print-and-go. Each activity sheet guides students through the project. STEM Challenge Overview:Students will use the included visual directions, graphic organizers, chart
Subjects:
Grades:
3rd - 6th
Types:
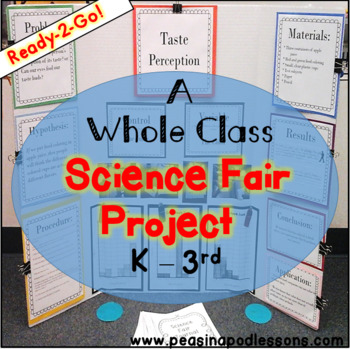
End of the Year Easy Science Experiments Activity Fair Project Scientific Method
A ready-to-go experiment ~ whole class ~ EASY science fair project for your k-3 class! Follow the scientific method and use the pre-typed science fair board labels for your display or have the kids fill in the blank lined versions, depending on your timeline. The planning is done for you! Differentiated student journals are also included. They follow the scientific method, but are kept simple for primary. Dotted guidelines are provided for students who are still learning to write.Topic: Taste P
Subjects:
Grades:
K - 3rd
Earth Day Math Project for Graphing and Data Interpretation
This resource is included in PDF format for printing and in Google Slides™️ format for digital learning. This makes it useable with Google Classroom™️.Are you looking for a way to reinforce graphing and data interpretation concepts in an engaging way that helps your students make connections? “Our Earth” is a real-life math project where students will complete eleven different graphing and data-related tasks. These activities can be used as a package, or in isolation. They work great as a math c
Subjects:
Grades:
2nd - 3rd
Also included in: Math Projects & Escape Rooms for Grades 2-3 | Bundle of Ten
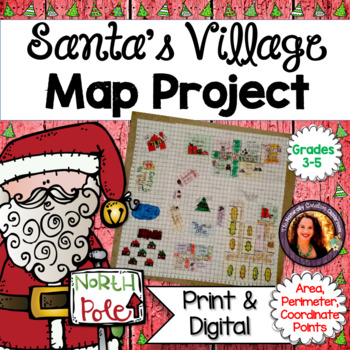
Christmas Math Activity Bundle | Area, Perimeter & Graph Map Project
Design the North Pole! Keep students engaged and learning during this busy time of year! This Christmas Math Activity project is a hands-on way to reinforce area, perimeter, factor pairs, map skills and finding and identifying coordinate points on a graph. For each item student are asked to record the arrays used, multiplication facts that helped them, the total area and the perimeter of each item. Some items are a simple rectangle, while other aspects, such as the reindeer barn have rooms wi
Grades:
3rd - 5th
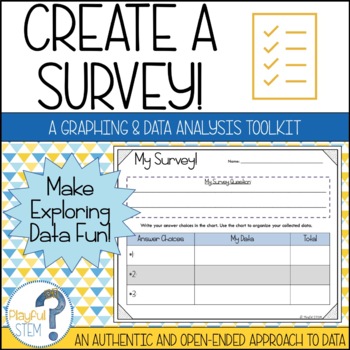
Create Your Own Survey: Collect, Organize, Graph, and Analyze Data
One of my best-selling TPT products -- now updated with a fresh look and new content!Teach Data Analysis the open-ended and engaging way -- through student-directed surveys!This resource pack is designed to help students follow the process of creating a survey: they will brainstorm questions, collect data, organize their obtained data, create multiple graphs to show their data, and then reflect on and analyze what their data tells them.The survey pack includes the following:Brainstorming Survey
Subjects:
Grades:
2nd - 5th
Types:
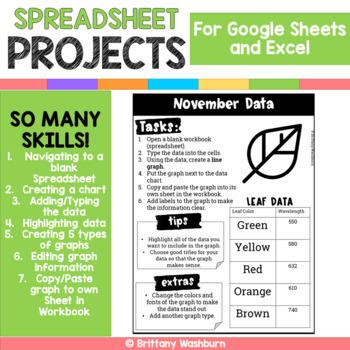
Google Sheets and Excel Spreadsheet Projects {12 Months}
12 projects with monthly themed data for students to practice creating spreadsheets in Google Sheets or Excel. There are 2 optional rubrics included too if you want to make this an assessment tool.SO MANY SKILLS!1. Navigating to a blank Spreadsheet2. Creating a chart3. Adding/Typing the data4. Highlighting data5. Creating 5 types of graphs6.Editing graph information7.Copy/Paste graph to own Sheet in Workbook1 for each month of the year (I stayed away from religious holidays)Works for any spreads
Grades:
2nd - 5th
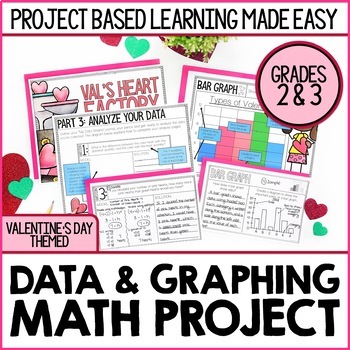
Valentine's Day Math Project | Conversation Hearts Graphing Lesson & Activity
This Valentine's Day-themed math project introduces your students to four methods for displaying data: Frequency TablesBar GraphsPictographsLine Plots Your students will record observations about each method for displaying data and compare/contrast methods for collecting data. Students will then use this knowledge to solve a problem for Val’s Heart Factory. Love this project idea, but planning to teach graphing at a different time of year? Sal's Sweet Factory will be a perfect fit for your class
Subjects:
Grades:
2nd - 3rd
Types:
Second Grade Social Studies-Common Core Economics Unit
This is an economics unit for second grade that is aligned with Second Grade Common Core Social Studies Standard E.1.1-1.6. This unit includes almost everything you need to teach this standard. There are lesson plans for you, a student book, a study guide, a test, a take home project with a parent letter, a wallet and money and a classroom game. This is a 10 day unit.
Subjects:
Grades:
2nd - 3rd
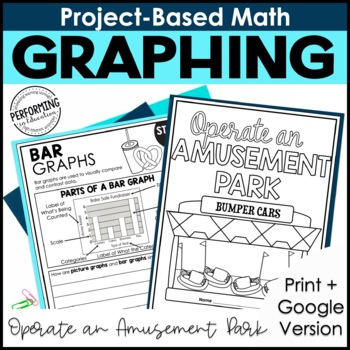
Math Project-Based Learning: Draw Picture Graphs & Bar Graphs | Data | 3rd Grade
This 5-day project-based math resource applies math concepts in a real-world scenario to teach students about drawing scaled picture graphs and scaled bar graphs. In this 5-day unit, students will apply graphing concepts to create scaled picture and bar graphs and answer questions about the data in the graphs. This graphing math project is engaging and authentic. Plus, it's available as both a digital and print resource.This project-based math resource covers concepts of rounding and is aligned
Subjects:
Grades:
3rd
Types:
CCSS:
Also included in: The Project-Based Math Library | 3rd Grade Math Project-Based Learning
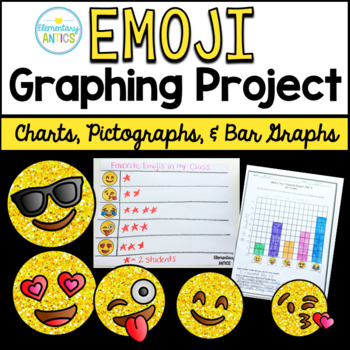
Emoji Graphs and Data Project {Charts, Pictographs, Bar Graphs}
This fun graphing project is a great way to introduce your students to collecting data and graphing- and the emojis keep them engaged and excited about learning!The Emoji Graphing Project includes 3 days of lesson plans!Part One: Conducting the SurveyPart Two: Making a Picture GraphPart Three: Create a Bar GraphAdditional Graphing Practice (3 more worksheets)Simple lesson plans are included for each part, but there is a ton of flexibility on how you can use this project in your classroom since y
Subjects:
Grades:
2nd - 3rd
Types:
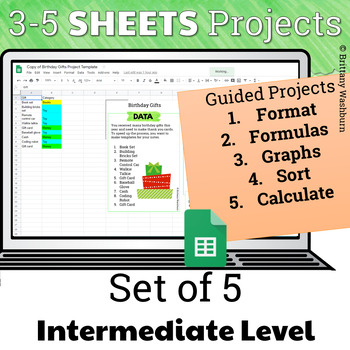
Google Sheets Projects for Grades 3-5
Guided Projects that Teach several skills in Google Sheets are the ideal way to build technology literacy for our youngest students. This set of 5 projects show students functions, formulas, formatting, graphing, calculations, and so much more so that by the time they get through the final project they could do it independently. Teacher Guide Includes:Standards AddressedLinks to the Google Sheets TemplatesHow to use the project templatesHow to use the printable PDF optionIncorporating the Spread
Grades:
3rd - 5th
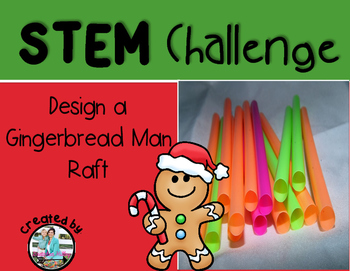
Gingerbread Man STEM Engineering Challenge
Save BIG with the STEM All Year bundle!
Gingerbread Man STEM Engineering Challenge
This unit includes:
Teacher tips page
Engineering Process Poster (black and white)
Challenge prompt page
Challenge rules page
Boat research graphic organizer
Engineering design process organizer
Results questions page
Gingerbread "cookie" cutouts
Was your boat successful? Graph appropriate for k-2
Graphing with technology ideas for upper grades
This product comes BUNDLED in a Christmas pack! Check it out here:
C
Grades:
K - 5th
Types:
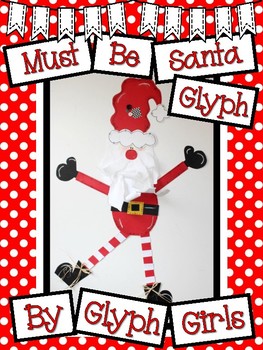
Must Be Santa Glyph (with Writing Option)
Glyph Girls has created the perfect combination of learning and fun! Students will create their own Santa Glyph using data gathered from a survey. Then, if desired, they can display creative writing inside the glyph.This 32 page resource includes:Colorful Example PhotosMaterials ListDetailed Instructions and TipsPhoto Directions for making Leg Stripes and BeardGlyph Survey and Key8 Data Collection/Graphing Sheets3 Writing TemplatesReady to Copy Patterns to make SantaTake a peek at the preview to
Grades:
PreK - 4th
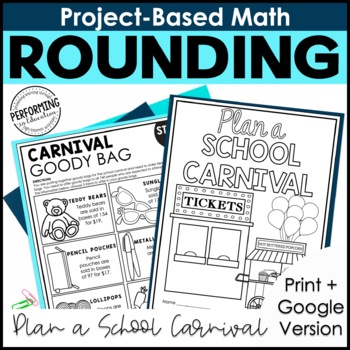
Math Project-Based Learning: Rounding to the Nearest 10 or 100 | Place Value 3rd
This 5-day project-based math resource applies math concepts in a real-world scenario to teach students about rounding to the nearest 10 and rounding to the nearest 100. In this 5-day unit, students will apply place value concepts to plan a school carnival. This rounding project is engaging and authentic. Plus, it's available as both a digital and print resource.This project-based math resource covers concepts of rounding and is aligned with the following 3rd Grade Math Common Core State Standar
Subjects:
Grades:
3rd
Types:
CCSS:
Also included in: The Project-Based Math Library | 3rd Grade Math Project-Based Learning
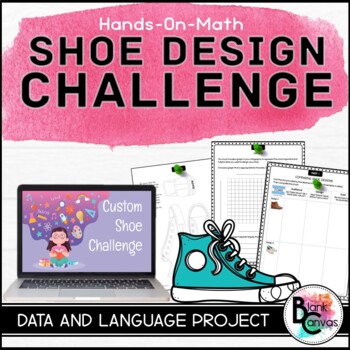
Shoe Design Challenge - A Data Management Project
Engage your students in data management with this fun and engaging cross-curricular shoe design challenge. This project based learning experience will have students collect data and analyze it to help design a shoe for a target audience. Once students have created their design, they will create an infographic about their shoe and persuade their audience on selecting the shoe. This organized 5-step process will be sure to encourage creativity. This project is versatile so you can adapt it to vari
Subjects:
Grades:
3rd - 8th
Types:
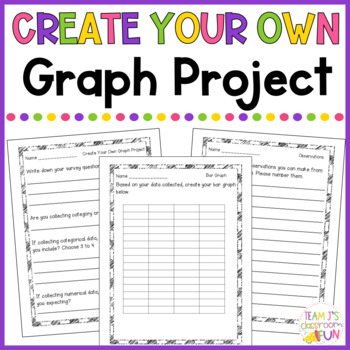
Graphing Project | Bar Graphs, Line Plot, Picture Graphs| Data Analysis Activity
Wrapping up your graphing unit is easy and fun with this project! This engaging activity provides students with a chance to apply their graphing skills, vocabulary, and knowledge to this final project. This no prep resource is easy to use - just print and go!Included in this resource:Teacher DirectionsPlanning PagesData Collection PageChecklistGraphing Pages (bar graph, pictograph, and line plots options)Observations Page Here are a few ways you can use this resource:• Independent Project• Pa
Subjects:
Grades:
1st - 3rd
Types:
CCSS:
The Great Graphing Project - Math Activity
This project is for students to practice and review different types of graphs: bar, picture, line, line plot, and for a challenge, a circle graph. This makes a terrific math center activity, test prep, or graphing review project! In this project, students will need to collect data by surveying the class to create a bar and picture graphs. Creating their own survey question and asking their classmates to collect their data allows for each student to have ownership over the information they want t
Grades:
2nd - 4th
Types:
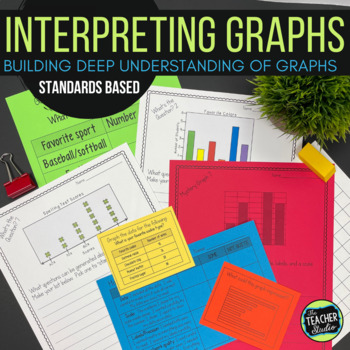
Graphs and Interpreting Graphs Activities - Hands On Data Investigations
What IS this graphing resource? These are NOT your typical graphing activities...and they are not just "busy work" for students--these graphing lessons are meant to be collaborative, instructional, rigorous, and FUN! Students need to have experience creating and interpreting graphs, so we need graphing lessons that are more than fill-in-the-blank worksheets. That's how we get students to understand that data has a purpose and that graphs show that data well.This resource includes opportunities
The Great Graphing Project
This is a printable project activity for your students to complete after they are finished studying about Graphs. It includes 11 pages:
Page 1 - Student Instructional Sheet
Page 2 - Survey
Page 3 - Frequency Table Template
Page 4 - Line Plot Template
Page 5 - Pictograph Template
Page 6 - Bar Graph Template
Page 7 - Circle (Pie) Graph Template
Page 8 - Line Graph Template
Page 9 - Stem and Leaf Plot Template
Page 10 - Histogram Template
Page 11 - Grading Rubric
I put all these pages together in
Grades:
3rd - 9th
Types:

Rockets with STEM and Straws
STEM SWOOSH! : Soda Straw Rocketry with Aeronautical EngineeringDo you have straws, pencil, paper, scissors, and an hour? Add our lesson and you have an easy STEM activity for your class. Perfect for the hallway on a rainy day or outside when the sun cooperates. You can even integrate it into a math lesson by having the kids measure the distance flown. Or use it to teach scientific variables by changing the length of the straw or size or location of the fins. Need a graphing assignment? this pro
Subjects:
Grades:
2nd - 6th
Types:
NGSS:
3-5-ETS1-3
, 3-5-ETS1-1
, 3-5-ETS1-2
Also included in: STEM Activities | Fifty Lessons Mega Bundle
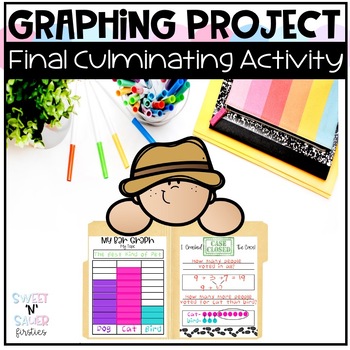
Data Collection and Graphing Project
Are you looking for a fun, authentic, and engaging way for students to practice all their graphing skills? Your students will LOVE being data collection detectives!This fun detective themed resource gives you everything you need for a jam packed hands on graphing project! Included in this resource you'll find a student detective folder that includes practice for organizing, sorting, representing, and answering questions about data. There are also in depth teacher directions included and an adora
Subjects:
Grades:
K - 3rd
Also included in: Data and Graphing Unit Bundle
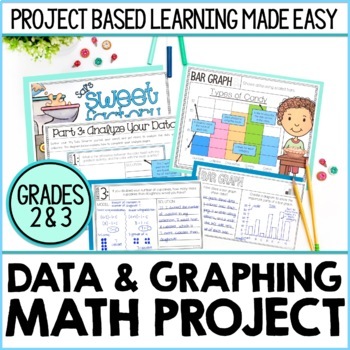
2nd & 3rd Grade Data and Graphing Math Project | Bar Graphs, Line Plots & More
This graphing math project introduces your students to four methods for displaying data: ★ Frequency Tables ★ Bar Graphs ★ Pictographs ★ Line Plots ★Your students will have the opportunity to record observations about each method for displaying data and compare/contrast methods for collecting data. They will then use this knowledge to solve a problem for Sal’s Sweet Factory. ***************************************************************************THE BIG PROBLEM YOUR STUDENTS WILL SOLVE:Sal's
Subjects:
Grades:
2nd - 3rd
Types:
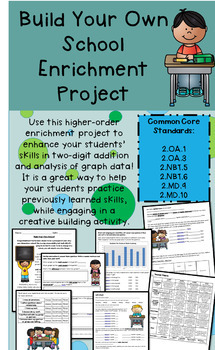
Grade 2 Math Enrichment Project - Two-Digit Addition - "Build Your Own School"
**ANSWER KEY and RUBRIC INCLUDED**This is a second enrichment project I created to help push my higher level math thinkers in grade 2 to the next level of real-world math application. Though I used it for grade 2, it could easily be used for grades 3 and 4 as well. In this project, students are given the task to design their own school by deciding the number of classrooms, floors, teachers, and types of grades and classrooms. They will answer questions about their school and design a floor plan
Subjects:
Grades:
2nd - 4th
Types:
Also included in: ***BUNDLE*** Grade 2 Math Enrichment - FOUR Inquiry Based Projects
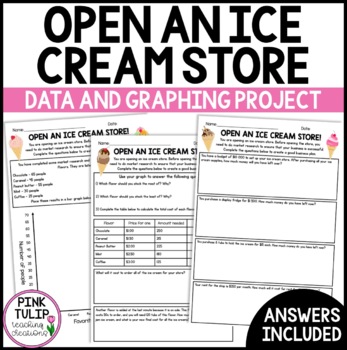
Open An Ice Cream Shop - Graphing and Data Math Activity
Open An Ice Cream Shop - Graphing and Data Math ActivityExtend understanding of graphing and data displays with this maths activity. This project is a great extension for early finishers, or the perfect assignment to implement at the end of a graphing and data module.This project encompasses a broad range of real-life mathematical skills, including budgeting and the four processes. It also requires students to research and price items for their store.This activity was designed to be used as a
Subjects:
Grades:
3rd - 6th
Types:
Also included in: Custom Order Resource Bundle #2
Showing 1-24 of 524 results


