70 results
Common Core HSS-ID.A.2 projects
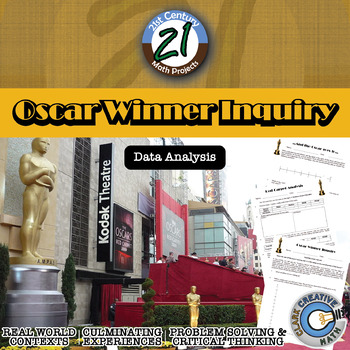
Oscar Winner -- Data Analysis & Statistics Inquiry - 21st Century Math Project
Utilize the last twenty years of Oscar winners as a data set to guide your students through creating box and whisker plots, histograms, and exploring mean, median, and mode -- in one 21st Century Math Project!Does the age of the award winning star in a film relate to the overall gross of the movie? Student will explore this inquiry question and use the data to support their conclusion.In this 8 page document you will be given a mapping to the Content Standards, an outline for how to implement t
Subjects:
Grades:
6th - 12th
Types:
Statistics Project - Statistics Olympics
Engage your students in their study of statistics as they compete in self-created Olympic style events. This project will engage students and help them discover meaning and apply concepts including measures of central tendency, quartiles, outliers, variance, standard deviation, z-scores, box plots, histograms, normal and skewed distributions. This project can be completed in approximately 6-8 days (50-min class periods) ** March 2023 Update **Visual updates to all slides and documentsRubric ali
Subjects:
Grades:
6th - 12th
CCSS:
Math March Madness Full Tournament Project {BUNDLE}
Harness the excitement of NCAA March Madness with this huge project for secondary math teachers that follows all stages of the tournament! This Common Core aligned bundle comes with bonus parts not sold individually in my store so you can create a rich immersion in the tournament, practice probability and statistics and learn some interesting new ones along the way! Save $3 plus get bonus content by bundling!You can pick and choose which parts you would like to incorporate, or follow my schedu
Subjects:
Grades:
6th - 12th, Higher Education
Types:
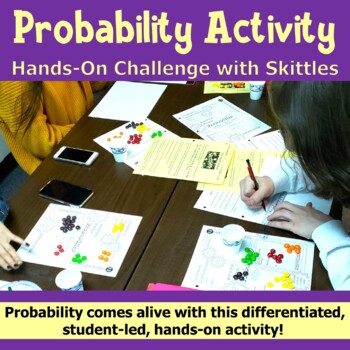
Probability Activity - Hands-On Challenge with Skittles - PBL with Math
Probability comes alive with this differentiated, student-led activity! The Skittles Probability Challenge provides practice using simple and compound probabilities in both theoretical and experimental fashion. Each student is given random data to work with. No two samples are identical. Students will: Make predictions based on logic.Determine the sample size of their personal data.Create a simple or two-way table to organize their data.Construct a graph or box & whisker plot to display the
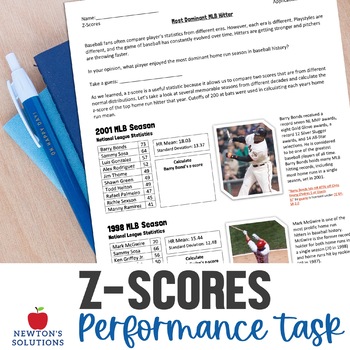
Z-Score and Normal Distribution Application Task Project
Z-Scores Application Task: In this project/application task, students will apply their knowledge of z-scores and use them in a real world situation. Students will take a look at data from different Major League Baseball seasons and compare sluggers from different decades. An answer key is included.___________________________________________________________________LICENSING TERMS: This purchase includes a single license that may only be assigned to a single specific individual user. Individual li
Subjects:
Grades:
9th - 11th
Types:
CCSS:
High School Data Analysis Project
This project covers a large range of data analysis methods. There are eleven total parts to the project.
Part One: the students have to collect data from 20 students outside of the classroom. Directions specify to ask students from each grade level.
Part Two: Measures of Center and Variation. Students will calculate mean, median, mode, range, and standard deviation for some of the data collected. Definitions of each term are included.
Part Three: Box-And-Whisker Plot. Students will create t
Subjects:
Grades:
9th - 12th
Types:
CCSS:
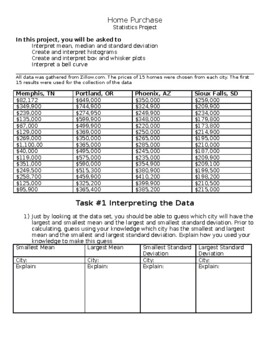
Home Prices: High School Statistics Project
This statistics project has students exploring home prices and using their knowledge of mean, median, standard deviation, histograms, box and whisker plots, and bell curves to make predictions and inferences about the data. This project is provided in a word document to allow the teacher the ability to edit the document or load it to a google doc. In this project students first make predictions about measures of spread and central tendency without calculating but by looking at the data. Students
Subjects:
Grades:
9th - 12th
Types:
CCSS:
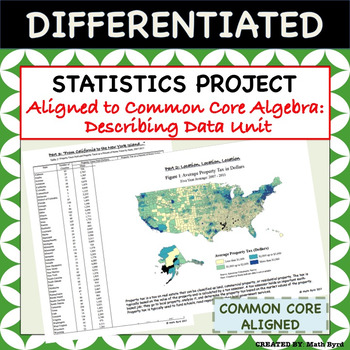
Statistics Project - Aligned to Common Core Algebra - Describing Data Unit
This differentiated U.S. Home Energy & Tax Themed Statistics Project covers all of the "describing data" standards of the Common Core Algebra Course using real data! Students will analyze various forms of tables & graphics to make inferences and interpret the data. The project is perfect for use as a summative assessment since students are required to justify their findings in open-ended format. Allow students to work in pairs, small groups, or individually! A grading rubric and selected
Subjects:
Grades:
8th - 11th
Types:
CCSS:
Also included in: Common Core Algebra 1 PROJECTS - BUNDLE PRICE!
AP Statistics
This AP Statistics curriculum bundle contains the following (please take time to preview video and/or individual item previews):Guided Notes and Graphic Organizers (EDITABLE)Exhibition stations (slides) with guided notes (EDITABLE)ActivitiesProjects (EDITABLE)Exams (EDITABLE)Teacher's pacing guide and suggested order for each unit Review in AP style for preparation for the APCOMING: powerpoint with guided notes for each of 9 units NEW! UNIT 1 and UNIT 2 slides and editable notes are currently in
Subjects:
Grades:
10th - 12th
CCSS:
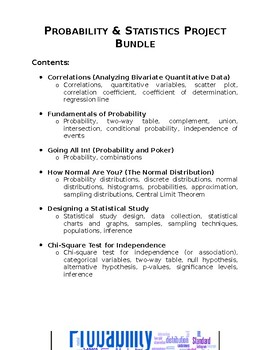
Probability & Statistics Project Bundle
A bundle that contains six different projects for a Probability & Statistics high school course. This bundle includes: Correlations (Analyzing Bivariate Quantitative Data) Fundamentals of Probability Going All In! (Probability, Combinations, and Poker) How Normal Are You? (The Normal Distribution) Designing a Statistical Study Chi-Square Test for Independence These projects are designed to engage students in authentic, hands-on, performance-based tasks. For each of these projects, students c
Subjects:
Grades:
9th - 12th
Types:
CCSS:

Statistics Survey Project - Project Based Learning (PBL) with Math
Watch your students dive into the world of math as they create, execute, and analyze their own survey! Students will demonstrate mastery of data gathering, survey sampling, developing appropriate survey questions, data tables, Direct Variation, discrete graphs, dot plots, box and whisker graphs, and calculating the inter-quartile range.The Unique Survey Project is highly engaging, capitalizing on the innate curiosity of the adolescent mind. You will love the low-prep instructional guide. Your st
Subjects:
Grades:
6th - 10th
Types:
Also included in: Fun with Ratios Activities Bundle - 7th Grade PBL with Math
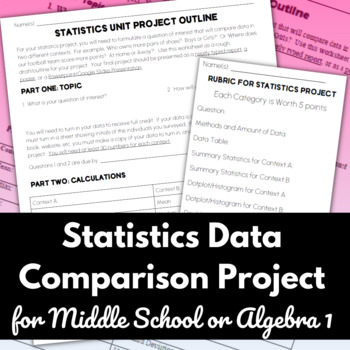
Statistics Data Comparison Project -Data Collection, Summary Statistics & Graphs
Engaging, easy prep statistics data collection project! Students develop a research question comparing data from two different contexts, collect data, then use summary statistics, measures of central tendency, and graphs to find the answer to their question. Perfect way to incorporate project-based learning into your statistics unit for middle school or algebra.Students choose a question of interest where they will compare two sets of data using summary statistics (mean, median, etc.) and graph
Subjects:
Grades:
7th - 9th
Types:
CCSS:

Stock Market Game - Stock Market Simulation Game for Middle and High School
THE STOCK MARKET GAME! Create a virtual Stock Exchange in your own classroom and allow students to experience the basics of investing!In The Stock Market Game, students are introduced to the foundations of investing and how the stock market actually works. Open their eyes to new possibilities and teach them a tool they can use to improve their financial future! (While implementing essential math standards, of course!)The Stock Market Game includes everything you need set the stage and experience
Subjects:
Grades:
6th - 12th
CCSS:
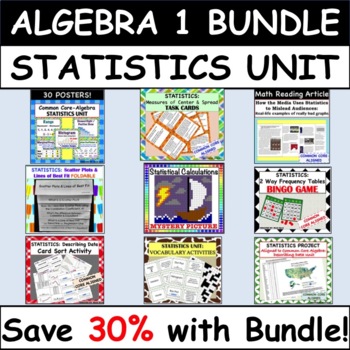
Common Core Algebra 1: STATISTICS UNIT - BUNDLE PRICE!
This Statistics Unit Bundle set includes a wide variety of 10 resources all geared towards the Common Core Algebra 1 course.Resources Included:Culminating Project Based on Real World Data30 PostersCard Sort ActivityMath Reading Article & Follow Up SummaryTask Cards ActivityFoldableMystery Color Picture Activity2 Vocabulary Activities including: Matching definition/vocabulary card set & crossword puzzleBingo GameLine of Best Fit - Class LabDifferentiation:Each resource in the bundle is di
Subjects:
Grades:
8th - 11th
Types:
CCSS:
Data Project Misleading Data Analysis Statistics
Statistics can be used to share information. Sometimes the data is misleading. In this AP Statistics mini project students examine how data can be used to tell a story AND how that story can be incomplete. This is part of the AP Statistics curriculum.Included in this resource:Warm-up activity for misleading dataMisleading data project guidelinesEditable RubricAnswer key for activityThis resource can be found in the following bundles:AP Statistics CurriculumAP Statistics Unit 1Get students r
Subjects:
Grades:
9th - 12th
Types:
CCSS:
Also included in: Descriptive Statistics AP Statistics

Normal Distribution in a real life context: Lake Tekapo Fish Mongers
Are you having trouble explaining what Normal distribution is and how it can be used in real life? Are your students craving a hands on activity that would make sense of this concept? Do you need an engaging project on statistics? Would you like an activity that already has enrichment, scaffolding and all of the material ready to go? If you answered yes to any or all of these questions, this project is tailor made for you!Your students will assume a role of a research team for a fishing company.
Subjects:
Grades:
10th - 12th, Higher Education
Types:
CCSS:
Crime Data Project
This project uses Crime Data to teach the following concepts1) How to calculate and interpret the mean and median2) How to calculate and interpret the standard deviation3) How to compare data sets using mean, median and standard deviation4) How to create a histogram, box and whisker plot and bell curve5) How to analyze histograms, box and whisker plots and bell curvesThe crime data from 5 cities was explored. *The name of the cities are listed on the teacher directions on the last page. Students
Subjects:
Grades:
9th - 12th
Types:
CCSS:
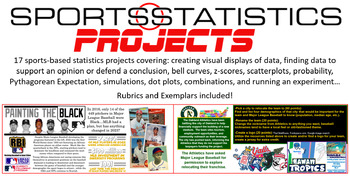
Sports Statistics - Projects ONLY! 17 projects in all
Most of the projects allow students to choose their own topic to display their understanding of statistical topics. Students will:Create a graph of their choosing given dataDesign an infographic on the subject of their choosingResearch and defend their G.O.A.T. choice in a variety of categoriesUse demographics to relocate and rebrand a professional franchiseResearch social injustices in sports and display the dataCreate a bell curve based on career statistics of Michael JordanCompare the salari
Subjects:
Grades:
8th - 12th
CCSS:
Fun with Ratios Activities Bundle - 7th Grade PBL with Math
The purpose of the Fun with Ratios Activities Bundle is to give students the opportunity to use creativity to apply ratios, proportions, and percentages in real-world settings. This bundle includes three unique tasks: Black Friday Mastery Task, Direct Variation Poster Mastery Task, and the Unique Survey Project. These activities and their accompanying materials are suited for students in grades 7 through 9. These lessons make excellent sub plans. Each project takes approximately two 60-minute bl
Subjects:
Grades:
7th - 9th
Types:
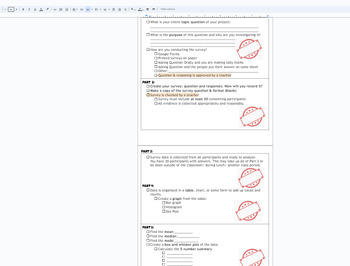
Statistics Survey project Discovery (broken down into sections) with Rubric
This is a broken down (scaffolded) packet of instructions/ guide for a Stats Project for Math 1 HS or 8th grade students. The goal of the project is for students to take a statistical survey on quantitative data (numbers) of their choice. Using this data from the survey, the following will be included in the project:Survey- the question being askedSurvey responses (requirement of 30)Data organization: Bar chart, Histogram, Dot PlotMeanMedianModeBox and Whisket Plot5 number summary (Q1,Q2,Q3, min
Subjects:
Grades:
7th - 12th, Higher Education, Adult Education
CCSS:
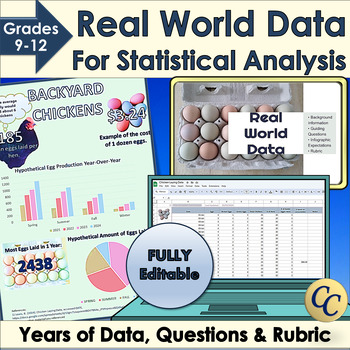
Real World Data for Statistical Analysis and Infographic Project
Give your students access to real world data for your statistical analysis unit or data literacy! Dive into statistics with Microsoft Excel™ or Google Sheets™ and years of data. Learn how to use standard deviation, mean or median to interpret data. Choose the best graphs to display conclusions in an infographic. Works great for science fairs! ✔ Includes an infographic project! (Template, expectations, and rubric). ✔ Everything is fully editable and you and your students can even use the images
Grades:
9th - 12th
Types:
CCSS:
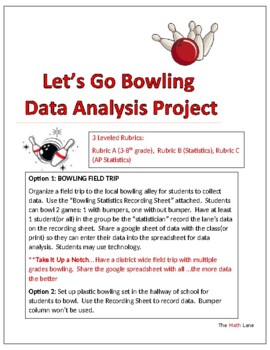
Let's Go Bowling Statistics STEM Project & Field Trip (3-12 and AP Stat)
Great END OF YEAR project. Get ready to strike up some fun with your students on a field trip to the bowling alley or right in your own hallway with a plastic bowling set! This isn't just any ordinary field trip - it's a real-world data collection extravaganza. 3 different leveled rubrics (Grade 4-10, Statistics, AP Statistics) so students can analyze the data based on their math knowledge. Students will be able to practice creating and analyzing graphical displays, scatterplots, construct c
Subjects:
Grades:
Not Grade Specific
Types:
Also included in: High School Statistics Project Bundle

Algebra 1 Discovery Lessons and Hands-On Activities
Looking for engaging ways to get your students to discover concepts in Algebra 1? These five activities will help your students develop deeper understanding with hands-on activities for measure of center, regression and residuals, solving by substitution, graphing piecewise functions and function transformation rules. Why get the bundle? ⭐ Save 20% on these tried and true activities!⭐ Get a variety of activities that you can use throughout the year.⭐ Unique and simple engaging activities for som
Grades:
8th - 9th
Types:
CCSS:
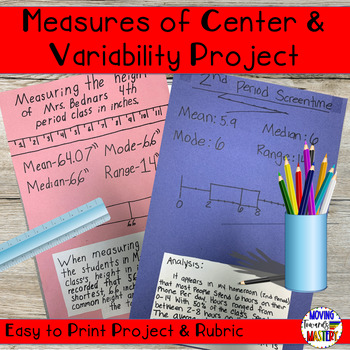
Measures of Center & Measures of Variability Math Project
Project for measures of center & measures of variability for middle school or high school math. Students will gather data and calculate mean, median, mode, ranges, & quartiles. Students will create a box & whisker plot and analyze the data collected.Measures of Center & Variability Project includes:♦ Suggested Lesson Plans♦ Suggested Topics of Interest♦ Student Directions & Project Plan♦ Student Recording Sheets→ Data Collection→ Organized Sheet to Show Calculations→ Sheet fo
Subjects:
Grades:
6th - 9th
Types:
Also included in: Middle School Math Projects for End of the Year Activities
Showing 1-24 of 70 results

