47 results
Common Core HSS-ID.A.2 graphic organizers
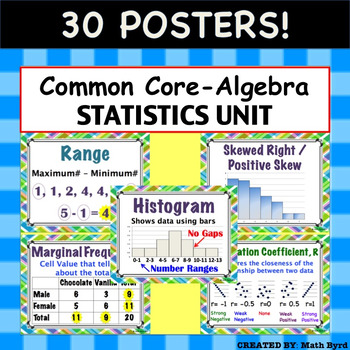
Common Core Algebra - Statistics Unit: Describing Data POSTERS
30 Posters! Each 8.5" x 11" in size. Posters are aligned with Common Core's Algebra - Statistics: Describing Data Unit. Posters Included:MeanMedianModeRangeInterquartile RangeOutlierMean Absolute DeviationMeasures of CenterMeasures of SpreadDot PlotHistogramBox PlotNormal/ Bell Shaped DistributionSkewed Right/Positive SkewSkewed Left/ Negative SkewUniform2 Way Frequency TableJoint FrequencyMarginal Frequency2 Way Relative Frequency TableConditional Relative FrequencyScatter PlotCorrelationCorrel
Subjects:
Grades:
8th - 11th
CCSS:
Also included in: Common Core Algebra 1 POSTERS - BUNDLE PRICE!
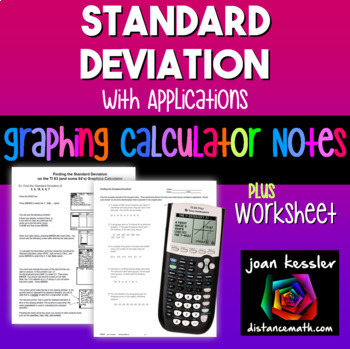
Standard Deviation on TI-84 Reference Sheets plus Practice
With this Determining the Standard Deviation on the TI 83 TI 84 Graphing Calculator plus HW step by step reference sheet your students will learn to use the graphing calculator effectively in finding the standard deviation from a data set. Use as Binder Notes or printed smaller for Interactive Notebooks.What's included?Two reference/handouts for students to learn how to find the Standard Deviation for both a population and for sample. One is for the TI 83 (yes, still in use) and the other for th
Subjects:
Grades:
8th - 11th
CCSS:
AP Statistics
This AP Statistics curriculum bundle contains the following (please take time to preview video and/or individual item previews):Guided Notes and Graphic Organizers (EDITABLE)Exhibition stations (slides) with guided notes (EDITABLE)ActivitiesProjects (EDITABLE)Exams (EDITABLE)Teacher's pacing guide and suggested order for each unit Review in AP style for preparation for the APCOMING: powerpoint with guided notes for each of 9 units NEW! UNIT 1 and UNIT 2 slides and editable notes are currently in
Subjects:
Grades:
10th - 12th
CCSS:

Algebra 1 End of Year Review Packet Print and Digital
I have bundled both the printable, foldable Algebra 1 EOC Review Packet Flip Book, with the Paperless, Digital Version of the Algebra 1 EOC Review for Google Slides™. The printable resource includes four versions of the book to meet your classroom needs, and the digital contains 13 interactive slides with fill-ins and matching. Choose the slides to include to customize for your students. Both come with full directions and answer keys. Please look closely at the individual previews and descri
Subjects:
Grades:
7th - 10th
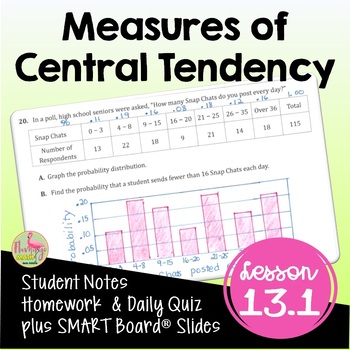
Measures of Central Tendency (Algebra 2 - Unit 13)
Measures of Central Tendency Algebra 2 Lesson:Your Pre-AP Algebra 2 Honors students will draw, analyze and interpret box-and-whisker plots, find outliers, and calculate measures of central tendency in this unit 13 lesson on Data Analysis & Statistics that cover the concepts in depth. #distancelearningtptWhat is included in this resource?⭐ Guided Student Notes⭐ Google Slides®⭐ Fully-editable SMART Board® Slides⭐ Homework/Practice assignment⭐ Lesson Warm-Up (or exit ticket)⭐Daily Content Quiz
Subjects:
Grades:
8th - 11th, Higher Education
CCSS:
Also included in: Algebra 2 Curriculum Mega Bundle | Flamingo Math
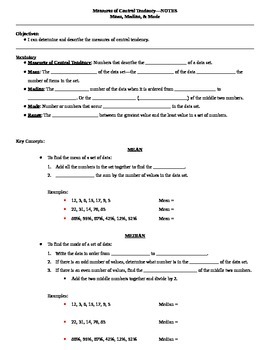
Measures of Central Tendency Guided Notes
These are guided notes for a lesson on measures of central tendency including mean, median, mode, and range. There are several examples in the notes and the same data sets are used to show each measure of central tendency.I have also included a teacher key to show you what to fill in the blanks as your students follow along.To use these notes, I simply projected them onto my whiteboard, gave the students their blank copies, and had them follow along and write what I wrote. This works great when
Subjects:
Grades:
5th - 12th
CCSS:
A Step-by-Step Guide to Calculating the Standard Deviation of a Data Set
This is set contains two standard deviation graphic organizers for students just introduced to the concept of standard deviations, students having trouble calculating the standard deviation of a data set, or students who require graphic organizers as a classroom accommodation.
The first organizer has a given data set (10 numbers total) and students fill in the boxes as they progress through each step of finding the standard deviation. The second does not give a data set, but is set up to wor
Subjects:
Grades:
9th - 12th
CCSS:
Measures of Central Tendency Foldable Flip Book
This Measures of Central Tendency Foldable Flip Book is a great way for your students to study the Mean, Median, and Mode . Students complete definitions plus 13 problems organized by type. All of the problems are applications.Each Foldable Flip Book requires only one sheet of 8½” by 11” paper. Easy to assemble - no glue, no tape, no mess. Easy to follow directions included as well as the Answer key. Final dimensions 5.5” x 5”. Please note: Two sided printing required._______________________
Subjects:
Grades:
7th - 10th
CCSS:
Also included in: Algebra Foldables and Organizers Bundle
Data Analysis and Statistics FOLDABLES™ (Algebra 2 - Unit 13)
This bundle of 8-page Bound-Book-Style Foldables includes six lessons on topics in UNIT 13: Data Analysis & Statistics for your Algebra 2 Honors students. A set of finished notes and directions for creating the Foldables are also included.⭐ Bonus: A set of Google Slides for presenting the lesson and video lesson links are now included for distance learning and flipped classroom methods.☆FOLDABLESThree options of an 8-page Bound-Book Foldable® will help with differentiation.Option #1: All voc
Subjects:
Grades:
8th - 11th, Higher Education
CCSS:
Also included in: Algebra 2 Curriculum Big Bundle | Flamingo Math
Central Tendency Mean Median Mode Standard Deviation Notes Color and B/W
These notebook pages and notes for Measures of Central Tendency are great for Algebra 2 and Statistics students. Choose from color or black and white notebook pages. This is the 1st lesson in Algebra 2 Unit 11 Data Analysis and Statistics . Included resources in this bundle:- Color-coded notebook pages- Black and white notebook pages - 6 Practice problems for class or homework- Answer KeyTopics included in Unit 11 Algebra 2 Data Analysis and Statistics:- Central tendency - Applying Transformat
Subjects:
Grades:
10th - 12th
CCSS:
Also included in: Algebra 2 Curriculum
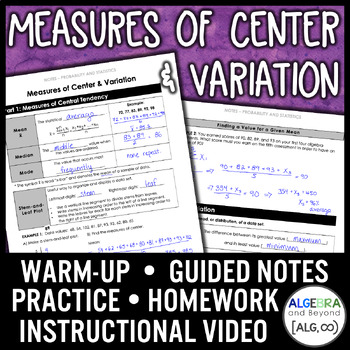
Measures of Center and Variation Lesson | Warm-Up | Notes | Homework
In this lesson, students learn about mean, median, mode, stem-and-leaf plots, variance, and standard deviation.Included• Video Warm-Up: Students preview the lesson by watching a short video on YouTube and then come to class with some prior knowledge. A warm-up handout included reviewing what students learned from the video. A bonus video link is also included!• Notes & Practice: Three pages of notes and practice.• Homework: Three pages containing 9 homework problems.• Answer Keys: Completely
Subjects:
Grades:
10th - 12th
CCSS:
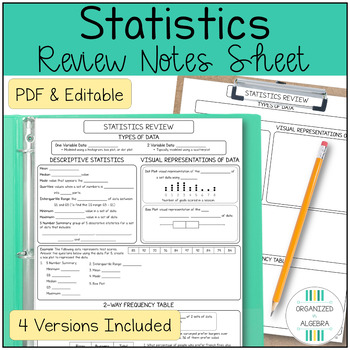
Statistics Review Notes Sheet Algebra 1 Test Prep
Looking for a review of Statistics that meets the needs of all your students, without the time commitment of differentiating?This no-prep, differentiated Algebra 1 Review Sheet is perfect to get your students ready for an end of chapter or end of year test in Algebra (including the NYS Algebra 1 Regents exam)!Includes 4 versions (Reference Sheet, Filled In Notes, Guided Notes & Graphic Organizer) and comes as a no prep, printable PDF AND an editable PowerPoint !Topics Included: Types of Data
Subjects:
Grades:
8th - 11th
CCSS:
Also included in: Statistics Algebra 1 Differentiated Notes & Worksheet Bundle
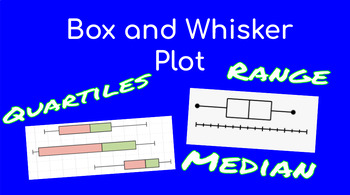
Box and Whisker Plots -- Video Notes, Graphic Organizer, and Differentiated WS
This set of video notes focuses on how to read and interpret a box and whisker and key features of the box plots. Topics include median, range, quartiles, interquartile range. Students learn how to use a box and whisker plot to compare data sets. Video includes definitions, explanations, and examples including released end of course test questions.Included:-Link to Downloadable/sharable .mp4 video, Box and Whisker Plots (10:53)-Matching Graphic Organizer for Student Use-Differentiated Practic
Subjects:
Grades:
8th - 9th
CCSS:
Displaying Data notes Histogram Box Plot Dot Plot Stem and leaf plot
Guided notes for descriptive statistics and displaying data includes bar graph, histograms, dot plots, box plots (aka box and whisker plot), and stem-and-leaf plots. This is Unit 1: lesson 3 in the AP Statistics Curriculum.Included in this resource:Interactive notebook pages graphic organizersGuided notes Practice ("try it") pages for individual or partner work NotesAnswer keyTopics included:Construct and analyze a bar graphConstruct and analyze a histogramBar graph vs histogramConstruct and an
Subjects:
Grades:
9th - 12th
CCSS:
Also included in: Descriptive Statistics AP Statistics
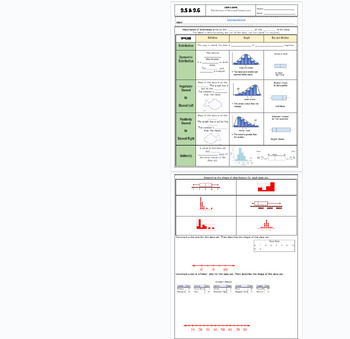
Data Distribution positive/negative skewed fillable notes UPDATED
Unit 9: Data and Stats: Updated(No 9.3/ Skip)9.5/9.6 Data Distribution (skewness)Students go over the vocabulary and complete the examples with the vocabulary scaffolded. Skewness is explained and how to identify it comparing data charts and box and whisker plots. Uses many visuals and examples to differentiate between that different graphs. Notes are scaffolded. Includes hook video hyperlinked on the "learning objective" title. Key is included and hyperlinked as a PDF in the heading highlighted
Subjects:
Grades:
6th - 12th, Higher Education, Adult Education
CCSS:
Also included in: Unit 9: Data and Statistics Fillable Notes
Margin of Error and Working with Samples Notes Algebra 2 Statistics
These notebook pages and notes for Working with samples and margin of error are great for Algebra 2 and Statistics students. Choose from color or black and white notebook pages. This is the 4th lesson in Algebra 2 Unit 11 Data Analysis and Statistics . Included resources in this bundle:- Color-coded notebook pages on sampling and margin of error- Black and white notebook pages on sampling and margin of error- 6 Practice problems for class or homework- Answer KeyTopics included in Unit 11 Algeb
Subjects:
Grades:
10th - 12th
CCSS:
Also included in: Algebra 2 Curriculum
Choosing a Data Display
This is an editable copy of a notes outline for Algebra 1. This outline is designed to be used within the Descriptive Statistics Unit. These notes cover choosing the best way to display your data and misleading graphs that can create bias. Check out my other notes outlines and my student reflection tools that align with the notes for each unit!
Subjects:
Grades:
9th - 12th
CCSS:
Also included in: Descriptive Statistics Notes and Student Reflection Bundle
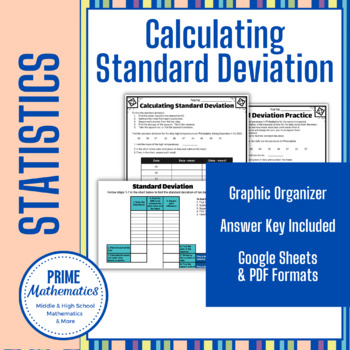
Calculating Standard Deviation Graphic Organizer
Use this graphic organizer to teach students the process of finding the standard deviation of a data set. In addition to the pdf, a self-checking Google Sheet is also included. The data sets from the pdf can be used in the Google Sheet or you can use any data set of ten items (and it still checks each step of the process). This product includes:a Graphic Organizer worksheet pdf with two sets of data and a blank versionan answer key for the Graphic Organizer worksheet pdfa self-checking Google Sh
Subjects:
Grades:
6th - 12th
CCSS:
Standard Deviation Fillable Notes UPDATED
Unit 9: Data and Stats: Updated(No 9.3/ Skip)9.4 B Standard DeviationStudents go over the vocabulary and complete the examples with the vocabulary scaffolded. Standard deviation is long hand calculated by showing each step of the process (difference of squares). Real-world examples are explained in notes before calculating to show the importance of this stat and why it is used so often to verify valuable and effective data. Notes are scaffolded. Includes hook video hyperlinked on the "learning o
Subjects:
Grades:
7th - 12th, Higher Education, Adult Education
CCSS:
Also included in: Unit 9: Data and Statistics Fillable Notes
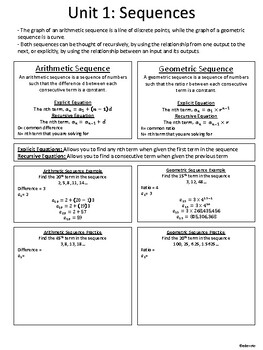
Open Up Algebra 1: EOY One Page Chapter Reviews
End of Year One Pager reviews for each chapter in Illustrative Math Algebra 1 Open Up Curriculum. Reviews include practice problems for students and act as a study guide to save for future lessons or final exams.
Subjects:
Grades:
7th - 10th
CCSS:
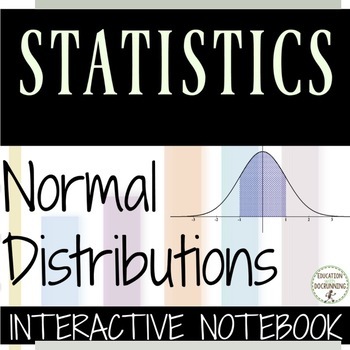
Normal Distribution Notes with z scores Statistics
These notebook pages and notes for Using Normal Distributions are great for Algebra 2 and Statistics students. Choose from color or black and white notebook pages. This is the 3rd lesson in Algebra 2 Unit 11 Data Analysis and Statistics . Included resources in this bundle:- Color-coded notebook pages- Black and white notebook pages- Answer KeyTopics included in Unit 11 Algebra 2 Data Analysis and Statistics:- Central tendency - Applying Transformations of Data- Normal Distributions - Selecting
Subjects:
Grades:
10th - 12th
CCSS:
Also included in: Algebra 2 Curriculum
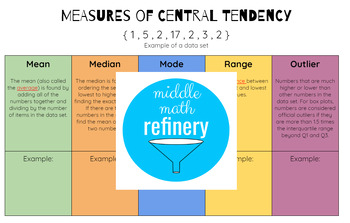
Measures of Central Tendency (Mean, Median, Mode, Range, Outlier)
This user-friendly resource is a great reference sheet for students learning about measures of center (mean, median, mode, range and outliers). Having tools like this to reference while working helps students to remember concepts and encourages self-reliance and ownership of own's learning. This resource works well in a graphic organizer and also word walls.Included: black and white printablecolor printableblack and white printable with answer keycolor printable with answer key
Subjects:
Grades:
6th - 10th
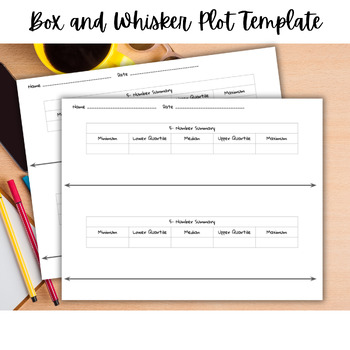
Box Plot Template | Box and Whisker Plot Template | Graphing Template
Box and Whisker Plot TemplateSay goodbye to data confusion and hello to organized insights with our Box Plot Template! This tool simplifies data organization with a five-number summary and a ready-to-use number line, so students can jump right into visualizing data distributions.With two box plots on one paper, students can easily compare data, spot outliers, identify medians, quartiles, and more - all at a glance!
Subjects:
Grades:
8th - 12th
CCSS:
Measures of Central Tendency Notes Mean Median Mode IQR AP Statistics
Guided notes for measures of central tendency including mean, median, mode, range and interquartile range. Standard deviation and variance are addressed in a separate lesson. This is Unit 1 lesson 2 in the AP Statistics curriculum:Included in this resource:2 options for notes:Interactive notebook pages (small)Guided notes (large)Card matching activity for mean, median and modeNotesAnswer keyTopics included:MeanMedianModeRangeInterquartile rangeThis resource can be found in the following bundle
Subjects:
Grades:
9th - 12th
CCSS:
Also included in: Descriptive Statistics AP Statistics
Showing 1-24 of 47 results

