Probability Activity - Hands-On Challenge with Skittles - PBL with Math
- PDF
What educators are saying
Description
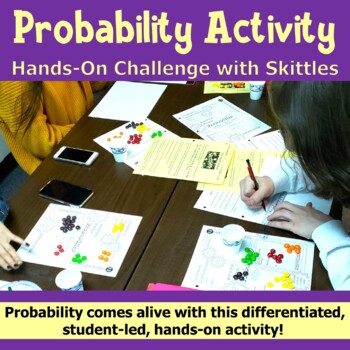
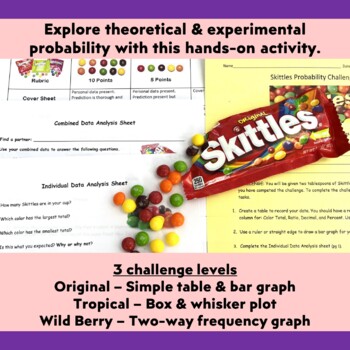
Probability comes alive with this differentiated, student-led activity! The Skittles Probability Challenge provides practice using simple and compound probabilities in both theoretical and experimental fashion. Each student is given random data to work with. No two samples are identical.
Students will:
- Make predictions based on logic.
- Determine the sample size of their personal data.
- Create a simple or two-way table to organize their data.
- Construct a graph or box & whisker plot to display their data.
- Calculate simple probability.
- Compute compound probability.
- Evaluate the difference between “and” & “or” in a probability statement.
- Analyze outcomes.
- Work collaboratively to evaluate a combined sample.
- Explore real world applications for probability.
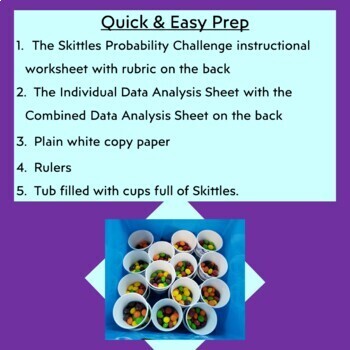
You will love the easy prep … make some copies and bring some Skittles. I have provided a prep list for you.
Your students will love the engaging, collaborative atmosphere of experimentation. They will enjoy exploring ideas, engaging in mathematical discussion, and finding real-world conclusions.
Probability will become everyone’s favorite unit of the year. Inquiry-based learning leads to greater retention. It’s a win-win!
This product includes three versions of the activity, meeting the needs of students in advanced 5th grade through high school. Students should already know how to multiply with rational numbers. This project takes one to two hours to complete based on student mathematics level. It’s a great project for the end of the year, practice for the 7th Grade SBAC Performance Task, or an introductory activity for a unit on 10th grade probability.
The following downloads are included with this project:
- Teacher Instructions
- Student Instructions (3 versions)
- Individual Data Analysis Worksheet (3 versions)
- Combined Data Analysis Worksheet (3 versions)
- 6 Enrichment Extension Ideas
- Sample Keys (3 versions)
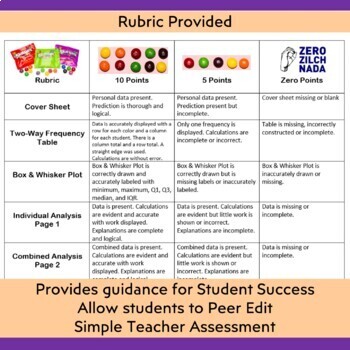
- Grading Rubrics (3 versions)
- Student samples
**************************************************************************************************
What other teachers are saying…
“Fun way to explore theoretical and experimental probability!”
Katie V. (7th grade)
“This is a great activity to practice probability concepts. It is all built right in AND it comes with three levels for differentiation included, saving me so much time and effort.” Jennifer C.
“I liked this project because it was differentiated and completely student led. This is a great resource to reinforce probability, and my students enjoyed doing it.”
Deana H. (7th grade)
“I used this project with a high school class. I used the extension options to adjust the expectations to meet the level of our class. The students were highly engaged & enjoyed the project. The inclusion of a grading rubric and student sample made this project easy to explain and assess.”
Lori Y. (11th grade)
My 7th grade students loved this assignment! It was challenging and creative. Thanks!
Mary G. (7th grade students on the autism spectrum)
I used this product with my Geometry students during our last class period. It kept them engaged and learning even throughout our last class period togethe
Jennifer W. (9th-10th grades)
**************************************************************************************************
You may also enjoy...
Bucketball Experiment Statistics Activity & Task (8th -10th)
Mosaic Probability – 7th Grade SBAC Math Performance Task (PT) Test Prep
Da Vinci Project - Color by Number with Probability (6th - 8th)
Da Vinci Project – Color by Number with Probability for High School (8th -12th)
**************************************************************************************************
Customer Tips: How to get TPT credit for future purchases:
Go to your “My Purchases” page. Next to each purchase, you'll see a “Provide Feedback” button. Simply click it and you will be taken to a page where you can give a quick rating and leave a short comment for the product. Each time you give feedback, TPT gives you feedback credits that you may use to lower the cost of your future purchases. We'd really love it if you'd rate our item after downloading! Feedback is so VERY important!
**************************************************************************************************
Follow my Store
Click on the green star next to our store logo to receive upcoming sales, freebie and product launches, and email updates!
Here's to a successful year!
Absolute Value
Petty415@gmail.com
For more Project Based Learning with Mathematics available at my store: https://www.teacherspayteachers.com/Store/Absolute-Value. This project was created and provided by Absolute Value.


