TPT
Total:
$0.00

Z-Score and Normal Distribution Application Task Project

Rated 4.88 out of 5, based on 8 reviews
4.9 (8 ratings)
;
Newton's Solutions
109 Followers
Grade Levels
9th - 11th
Resource Type
Standards
Formats Included
  • Zip
$3.00
$3.00
Share this resource
Report this resource to TPT
Newton's Solutions
109 Followers

What educators are saying

kept my stats students engaged on a Friday afternoon! They found the real-world application of "z-scores" to be interesting
It was a great project for my students. I added more to it to give it more higher order thinking for my 11th and 12th graders but overall good.

Description

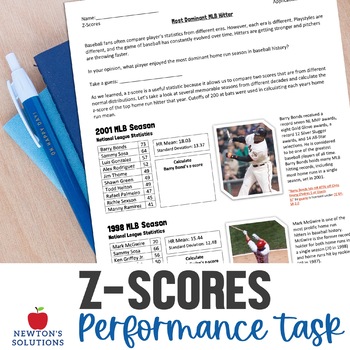
Z-Scores Application Task:

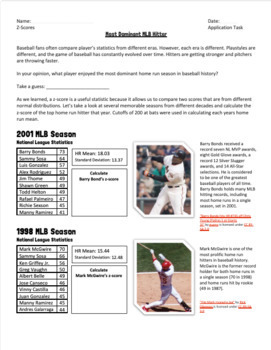
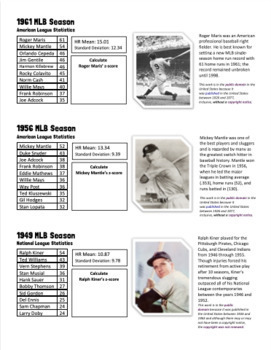
In this project/application task, students will apply their knowledge of z-scores and use them in a real world situation. Students will take a look at data from different Major League Baseball seasons and compare sluggers from different decades.

An answer key is included.

___________________________________________________________________

LICENSING TERMS: This purchase includes a single license that may only be assigned to a single specific individual user. Individual licenses are non-transferable and may not be used by or reallocated to a different teacher.   No part of this resource is to be shared with colleagues or used by an entire grade level, school, or district without purchasing the proper number of licenses.

COPYRIGHT TERMS: This resource may not be uploaded to the internet in any form, including classroom/personal websites or network drives, unless the site is password protected and can only be accessed by students.

Total Pages
Answer Key
Included
Teaching Duration
45 minutes
Report this resource to TPT
Reported resources will be reviewed by our team. Report this resource to let us know if this resource violates TPT’s content guidelines.

Standards

to see state-specific standards (only available in the US).
Use statistics appropriate to the shape of the data distribution to compare center (median, mean) and spread (interquartile range, standard deviation) of two or more different data sets.
Use the mean and standard deviation of a data set to fit it to a normal distribution and to estimate population percentages. Recognize that there are data sets for which such a procedure is not appropriate. Use calculators, spreadsheets, and tables to estimate areas under the normal curve.

Reviews

Questions & Answers

109 Followers