25 results
Common Core HSS-ID.A.2 independent work packets
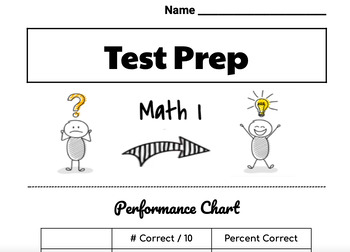
Math I End of Course Exam TEST PREP package
Math I End of Course Exam Test Prep packageIncludes 10 individual practice "lessons" that each contain 10 problems.Each practice lesson includes both a Calculator Inactive portion and a Calculator Active portion.The included Performance Chart allows for students to keep track of their progress as they strive to make improvement as they progress through the 10 lessons. I suggest providing each student a copy of the Performance Chart on colored paper to keep and record progress.The specific imple
Subjects:
Grades:
8th - 10th
CCSS:
AP Statistics - 147 Google Form Companions for ALL AP Daily Videos
Do you require your students to watch the awesome AP Daily videos that College Board provides? Me too! But I needed a way to ensure the students were actually watching this resource and taking away all the valuable information they contain. These Google Forms allowed me to confirm that students were making the most of the AP Daily videos.This download contains 147 google forms. Each form is a companion to the 147 AP daily videos located in the AP Statistics course for all units from 1-9.
Subjects:
Grades:
9th - 12th
CCSS:
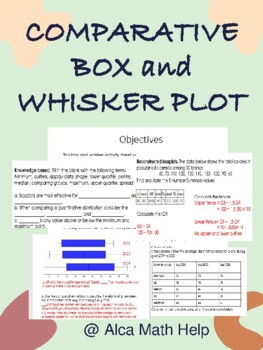
Comparison Box and Whisker Plots Worksheet, Quiz, Test for Stats & AP Stats
This box and whisker activity sheet was designed to test students understanding of the 5 number summary data values given quantitative data sets. Perfect for students in grade 10-12 doing statistics and you want to give them a challenge and should be manageable for students doing AP STATSAt the end of this activity students should be able to1. Students should be able to explain and construct box plots showing the different regions and what they represent. 2. Students should also be able to use
Subjects:
Grades:
11th - 12th, Higher Education, Adult Education, Staff
CCSS:

How to Use Desmos on Algebra 1 State Tests & EOC Exams PART 1
This is Part 1 of a 3 part series of lessons on using the Desmos graphing calculator to improve performance on Algebra 1 State Tests and EOC Exams.
Subjects:
Grades:
8th - 12th
CCSS:
Also included in: How to Use Desmos on Algebra 1 State Tests & EOC Exams

How to Use Desmos on Algebra 1 State Tests & EOC Exams PART 2
This is Part 2 of a 3 part series of lessons on using the Desmos graphing calculator to improve performance on Algebra 1 State Tests and EOC Exams.
Subjects:
Grades:
8th - 12th
CCSS:
Also included in: How to Use Desmos on Algebra 1 State Tests & EOC Exams

How to Use Desmos on Algebra 1 State Tests & EOC Exams PART 3
This is Part 3 of a 3 part series of lessons on using the Desmos graphing calculator to improve performance on Algebra 1 State Tests and EOC Exams.
Subjects:
Grades:
8th - 12th
CCSS:
Also included in: How to Use Desmos on Algebra 1 State Tests & EOC Exams
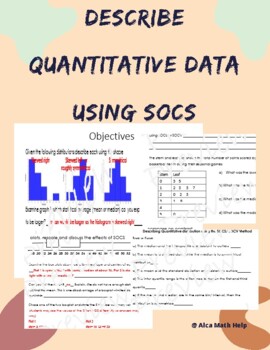
Describe Quantitative Data using SOCS/SOCV- Box plot, Histogram, Stem plot
If you are looking for a worksheet that can be used as a quiz, test, review packet you are at the right place. This activity sheet is suitable for students doing AP Stats and CP Probability and Statistics. This activity sheet allows students to:Use prior knowledge to answer true false questions and fill in the blanks with vocabulary provided.Describe box plots, histogram and stem plot using SOCS.Interpret the shape, center, outlier or any unusual feature along with the spread.
Subjects:
Grades:
11th - 12th, Higher Education, Adult Education, Staff
CCSS:
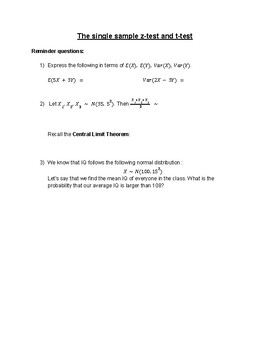
The z-test and t-test, IB HL Applications and Interpretations
In this fun activity, students are introduced to the z-test and t-test. They will spend 10 minutes taking a quick IQ test to generate data (which is included with answers), which will then be used to explore the question 'is the IQ of our class higher than that of the general population'. Unbiased estimators are also introduced. Full teacher version with answers included, although the answers will be different depending on the outcome of the student quizzes. Geared towards Higher Level IB Applic
Subjects:
Grades:
10th - 12th
CCSS:
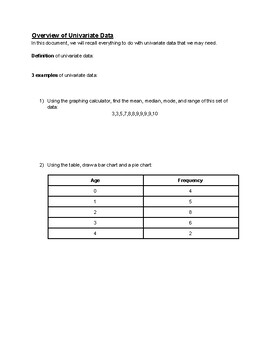
Univariate Data overview for IB Applications and Interpretations
Univariate data is usually already somewhat familiar to students in both SL and HL IB Applications and Interpretations. In this overview, students will review what they know, as well as have an opportunity to learn some simple skills that may be new to them. Everything is covered except for cumulative frequency: mean, median, mode, range, quartiles, IQR, grouped frequency tables, variance, standard deviation, box and whiskers plot, pie chart, bar chart, outliers.Students use some data gathered i
Subjects:
Grades:
10th - 12th
CCSS:
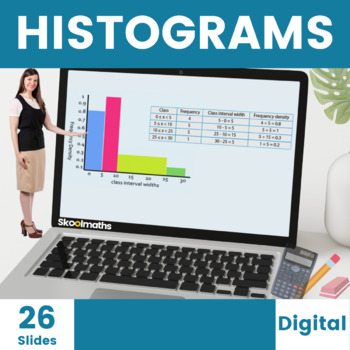
Histograms Digital Lesson for High School
Teach your High School students how to Interpret and Construct Histograms with unequal class intervals with these completely interactive digital home learning resources with engaging content and instant learner feedback. Buy this great value 26-page bundle of interactive histogram activities today to save you hours of planning and don't forget to leave an honest review if you download this worksheet for TPT credit :)Like this? You might also like...Conditional ProbabilityCalculating AveragesCond
Subjects:
Grades:
8th - 10th, Higher Education
CCSS:
Also included in: Complete Statistics and Probability Bundle | Digital and Print
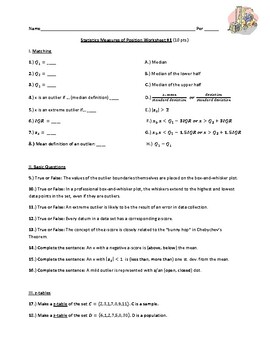
Measures of Position Worksheet #1
Review worksheet covering topics related to Measures of Position, including:1.) z-Scores2.) Fractiles (specifically Quartiles, Deciles and Percentiles)3.) Interquartile Range4.) Box-and-Whisker Plots5.) Outliers (using both the mean- and median-based definitions)There is also a problem asking students to recall concepts involving Measures of Central Tendency.This is the first in a series of four worksheets. They can each be assigned individually, or together as a total review packet.
Subjects:
Grades:
11th - 12th, Higher Education
CCSS:
AP Statistics - AP Daily Videos: Unit 1 Google Form Companions
Do you require your students to watch the awesome AP Daily videos that College Board provides? Me too! But I needed a way to ensure the students were actually watching this resource and taking away all the valuable information they contain. These Google Forms allowed me to confirm that students were making the most of the AP Daily videos.This download contains 14 google forms. Each form is a companion to the 14 AP daily videos located in the AP Statistics Unit 1: One Variable Data section.
Subjects:
Grades:
9th - 12th
CCSS:
Also included in: AP Statistics - 147 Google Form Companions for ALL AP Daily Videos
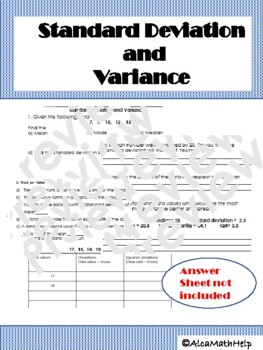
Standard Deviation and Variance AP Stats, CP probability and Statistics
If you are looking for an activity sheet that will help students to practice standard deviation and variance both by hand and the table. This is the activity you are looking for. Not too complex but requires some level of thinking.Objectives:1. Students should be able to interpret the relationship between the mean and standard deviation. 2. Students should know how the change in variables affects the spread and center. 3.Students will be able to complete a knowledge-based section by answering tr
Subjects:
Grades:
10th - 12th, Higher Education, Adult Education, Staff
CCSS:
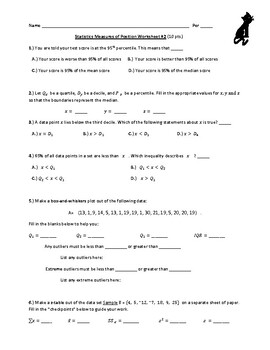
Measures of Position Worksheet #2
Review worksheet covering topics related to Measures of Position, including:1.) z-Scores2.) Fractiles (specifically Quartiles, Deciles and Percentiles)3.) Interquartile Range4.) Box-and-Whisker Plots5.) Outliers (using both the mean- and median-based definitions)The second page has problems from topics typically covered before Measures of Position in a Statistics course.This is the second in a series of four worksheets. They can each be assigned individually, or together as a total review packet
Subjects:
Grades:
11th - 12th, Higher Education
CCSS:
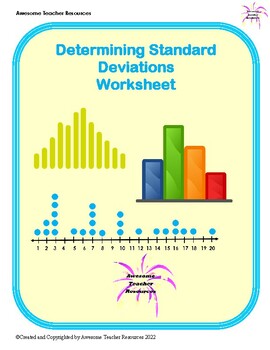
Determining Standard Deviations Worksheet
This worksheet begins with suggestions for reinforcement or enrichment with regards to data. In an effort to help students, there is an example problem at the start of the worksheet with step-by-step directions for finding the mean and standard deviation for a set of data. Then there are 5 problems, three of which have a set of data provided. The last 2 problems require students to have access to a 6-sided die and a deck of cards. Tables are provided to help organize calculations. There is an a
Subjects:
Grades:
7th - 10th
CCSS:
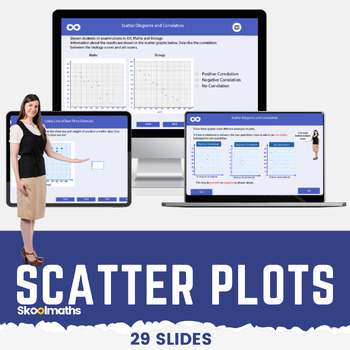
Scatter Plots | Correlation | Line of Best Fit Digital Math Lesson CCSS 8.SP.A.1
Scatter Plots | Correlation | Line of Best Fit Digital Math Lesson CCSS8.SP.A.1Want a high-engagement interactive math lesson that will teach your high school grade how to use and interpret scatter graphs; recognize correlation; draw and use lines of best fit to make predictions?In this lesson, learners will be able to:use and interpret scatter graphs of bivariate data;recognize different types of correlation;draw estimated lines of best fit; anduse lines of best fit to make predictions.The less
Subjects:
Grades:
8th - 10th
CCSS:
Also included in: Complete Statistics and Probability Bundle | Digital and Print
Variance and Standard Deviation Review
This product is a review of variance, standard deviation, and outliers.
Subjects:
Grades:
9th - 12th
CCSS:
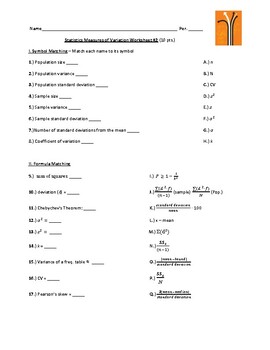
Measures of Variation Worksheet #2
Review worksheet covering topics related to Measures of Variation, including:1.) Deviation2.) Sums of Squares3.) Population and Sample Variation4.) Standard Deviation5.) Coefficients of Variation6.) Pearson's Index of SkewThere are symbol-matching and formula-matching sections on the first page, and the last page contains review problems from topics typically covered before Measures of Variation in a Statistics course.This is the second in a series of four review worksheets. They can each be ass
Subjects:
Grades:
11th - 12th, Higher Education
CCSS:
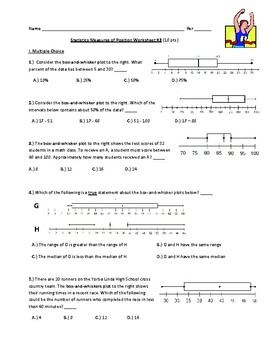
Measures of Position Worksheet #3
Review worksheet covering topics related to Measures of Position, including:1.) z-Scores2.) Fractiles (specifically Quartiles, Deciles and Percentiles)3.) Interquartile Range4.) Box-and-Whisker Plots5.) Outliers (using both the mean- and median-based definitions)The second page has a section of problems from topics typically covered before Measures of Position in a Statistics course.This is the third in a series of four worksheets. They can each be assigned individually, or together as a total r
Subjects:
Grades:
11th - 12th, Higher Education
CCSS:
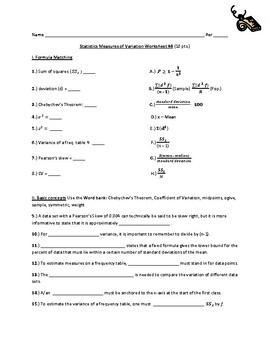
Measures of Variation Worksheet #4
Review worksheet covering topics related to Measures of Variation, including:1.) Deviation2.) Sums of Squares3.) Population and Sample Variation4.) Standard Deviation5.) Coefficients of Variation6.) Pearson's Index of SkewThere is a formula-matching section and a basic concepts fill-in-the-blank section on the first page, and last page contains review problems from topics typically covered before Measures of Variation in a Statistics course.This is the last in a series of four review worksheets.
Subjects:
Grades:
11th - 12th, Higher Education
CCSS:
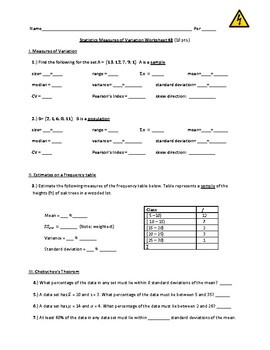
Measures of Variation Worksheet #3
Review worksheet covering topics related to Measures of Variation, including:1.) Deviation2.) Sums of Squares3.) Population and Sample Variation4.) Standard Deviation5.) Coefficients of Variation6.) Pearson's Index of SkewThe last page contains review problems from topics typically covered before Measures of Variation in a Statistics course.This is the third in a series of four review worksheets. They can each be assigned individually, or together as a total review package.
Subjects:
Grades:
11th - 12th, Higher Education
CCSS:
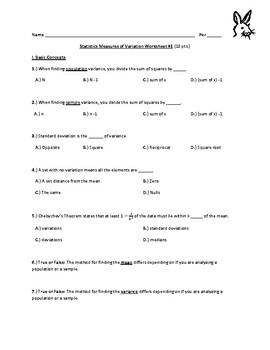
Measures of Variation Worksheet #1
Review worksheet covering topics related to Measures of Variation, including:1.) Deviation2.) Sums of Squares3.) Population and Sample Variation4.) Standard Deviation5.) Coefficients of Variation6.) Pearson's Index of SkewThere is a multiple-choice concepts section on the first page, and the last page has review problems from topics typically covered before Measures of Variation in a Statistics course.This is the first in a series of four review worksheets. They can each be assigned individually
Subjects:
Grades:
11th - 12th, Higher Education
CCSS:
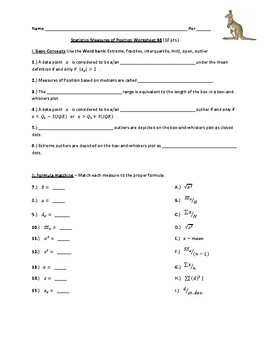
Measures of Position Worksheet #4
Review worksheet covering topics related to Measures of Position, including:1.) z-Scores2.) Fractiles (specifically Quartiles, Deciles and Percentiles)3.) Interquartile Range4.) Box-and-Whisker Plots5.) Outliers (using both the mean- and median-based definitions)This is the last in a series of four worksheets. They can each be assigned individually, or together as a total review packet.
Subjects:
Grades:
11th - 12th, Higher Education
CCSS:
Sampling and Statistics Take Home Packet
This packet can be used for many different needs. I am currently using this for virtual learning and giving it to students who need something different or more to understand the concepts. This resource is designed for supplemental instruction and can be used for reteaching, absent students, distance learning or additional practice. The topics included are: sampling methods, understanding changes in mean and median, interpreting box and whisker plots, interpreting histograms and interpreting stan
Subjects:
Grades:
8th - 11th
CCSS:
Showing 1-24 of 25 results

