12 results
Common Core HSS-ID.A.2 homeschool curricula
Algebra 1 Curriculum
Get a complete High School Algebra 1 curriculum including units on solving equations and inequalities, linear functions, exponents and exponential functions, factoring polynomials, quadratics, and more! These ready-to-use Algebra 1 resources include everything you need to teach high school algebra to your on-level or lower-level/special education class. Supplements would be needed for an honors class.Each unit contains guided notes, practice worksheets for the classroom and/or homework, activiti
Grades:
8th - 11th
CCSS:

Progress Monitoring Quizzes Bundle--MAAP Algebra I
This is a bundle of all the progress monitoring quizzes based on the MAAP (Mississippi Academic Assessment Program) Algebra I End-of-Course Assessment.These quizzes consist of 5 or fewer multiple-choice items that mirror the practice items from the MAAP State Test Practice Booklets.Check out other products in my store!
Subjects:
Grades:
9th - 12th
CCSS:
Data and Statistics (DS) Bundle
Shape, center and spread, the normal distribution, sampling and linear regression are all explored in this introduction to statistics. These missions are aligned with Common Core Standards from the Statistics and Probability category for 8th grade and high school.
The fun stuff:
Heart rates and marathons, coins and NBA heights, this bundle gives students the chance to explore shape, center, and spread with coins, dice, heights, shoe sizes and more. They also explore linear regression and even
Subjects:
Grades:
7th - 12th
CCSS:
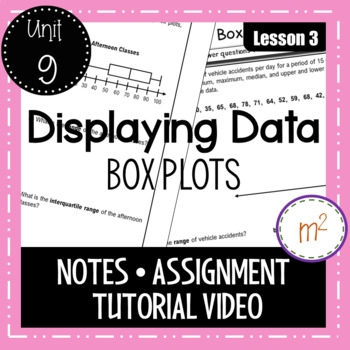
Box Plots Lesson - Algebra 1
Notes and assignment over Box Plots (Box and Whisker Plots) for Algebra 1. TUTORIAL VIDEO included (no prep to you!) and can be found on my YouTube Channel: mandy’s math world - the video is on the Algebra 1, Unit 9: Data and Statistics Unit Playlist! This is GREAT for distance learning as well as for students who are absent or who need to see the lesson again! This is the 3rd lesson in my soon-to-be completed Data and Statistics Unit for Algebra 1! This lesson is also included in my Algebra 1
Subjects:
Grades:
7th - 12th
CCSS:
Also included in: Algebra 1 Curriculum
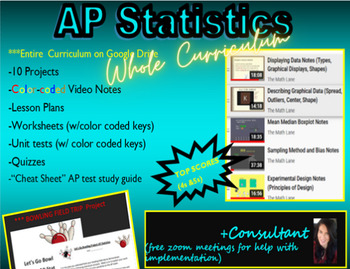
AP Statistics/Stats FULL Curriculum LINK (notes, wksts, PROJECTS) and Consultant
Get ready to supercharge your students' AP Statistics experience with this dynamic curriculum! With over 50% of students earning 4s or 5s on the AP exam, this program is proven to deliver top results. Featuring color-coded video notes, worksheets, activities, and 10 engaging projects, this curriculum is designed to keep students engaged and excited about statistics. Plus, with a Bowling Field Trip Project Opportunity included, students will have the chance to apply their knowledge in a real-worl
Subjects:
Grades:
10th - 12th
CCSS:

Other Problems--Set 1--Progress Monitoring Quiz #9--MAAP Algebra I
From these quizzes, you can identify each student’s rate of progress toward the instructional goal for the academic year. And you know immediately how well your students are performing. In this way, student progress monitoring also tells you how the student has responded to instruction, and whether or not instructional changes are needed.I mainly use these quizzes when reviewing for the end-of-course state assessment--Mississippi Academic Assessment Program (MAAP--Algebra I). When I have covered
Subjects:
Grades:
9th - 12th
CCSS:
Also included in: Progress Monitoring Quizzes Bundle--MAAP Algebra I
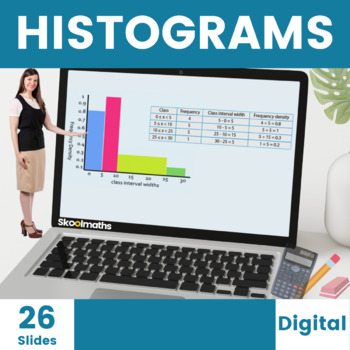
Histograms Digital Lesson for High School
Teach your High School students how to Interpret and Construct Histograms with unequal class intervals with these completely interactive digital home learning resources with engaging content and instant learner feedback. Buy this great value 26-page bundle of interactive histogram activities today to save you hours of planning and don't forget to leave an honest review if you download this worksheet for TPT credit :)Like this? You might also like...Conditional ProbabilityCalculating AveragesCond
Subjects:
Grades:
8th - 10th, Higher Education
CCSS:
Also included in: Complete Statistics and Probability Bundle | Digital and Print
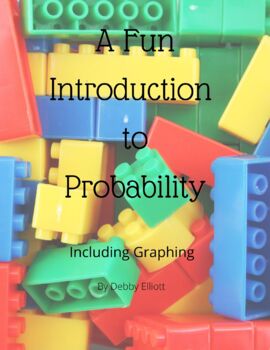
A Fun Introduction to Probability
This product contains fourteen pages that introduce probability by graphing the LEGOs and comparing the number of studs on LEGO bricks. These statistics will be figured in fractions, decimals and percentages. Graphing will be done on bar graphs and pie graphs. The worksheets are colorful and engaging for students. Students will learn to find the mean, median and mode of different numbers of studs on LEGO bricks. Students will find their own statistics and combine them with the statistics of ot
Subjects:
Grades:
4th - 9th

Stem and Leaf Diagrams - Digital Math Lesson and Activities for 9th - 10th Grade
A Stem and Leaf Plot is a special table where each data value is split into a "stem" (the first digit or digits) and a "leaf" (usually the last digit). In this lesson, learners will be able to use stem and leaf diagrams to calculate mean, median, mode, interquartile range, lower quartile, upper quartile, and analyze the given data using these measurements.This fun-packed math lesson can be used as whole class teaching by teachers and at home by learners; with lots of drag and drop activities as
Subjects:
Grades:
8th - 10th, Higher Education
Types:
CCSS:
Also included in: Complete Statistics and Probability Bundle | Digital and Print
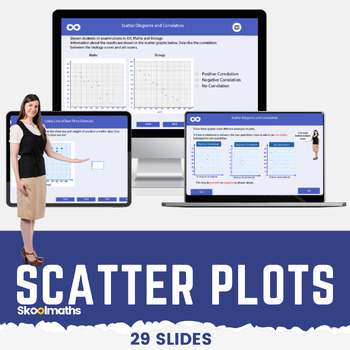
Scatter Plots | Correlation | Line of Best Fit Digital Math Lesson CCSS 8.SP.A.1
Scatter Plots | Correlation | Line of Best Fit Digital Math Lesson CCSS8.SP.A.1Want a high-engagement interactive math lesson that will teach your high school grade how to use and interpret scatter graphs; recognize correlation; draw and use lines of best fit to make predictions?In this lesson, learners will be able to:use and interpret scatter graphs of bivariate data;recognize different types of correlation;draw estimated lines of best fit; anduse lines of best fit to make predictions.The less
Subjects:
Grades:
8th - 10th
CCSS:
Also included in: Complete Statistics and Probability Bundle | Digital and Print
Shape, Center and Spread (DS2): HSS.ID.A.1, HSS.ID.A.2...
Students will gather data, compute statistics, represent the data graphically and interpret patterns in the data. This mission is aligned with Common Core State Standards: HSS.ID.A.1, HSS.ID.A.2, HSS.ID.A.3.
The fun stuff:
Heart rates, mid-day temperatures and marathons! Hey, those all seem rather related! Students will gather their own data as well as working with given data to visualize and calculate shape, center and spread. Box plots, medians, outliers and more are explored. A fun introduct
Subjects:
Grades:
7th - 12th
CCSS:
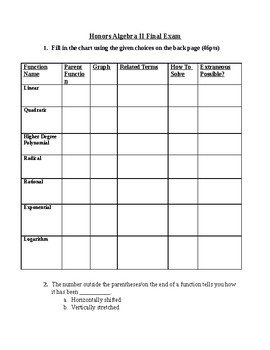
Honors Algebra 2 Final Exam
This is a concept based final exam suitable for average to honors level Algebra 2 curricula. It follows basic common core skill sets and includes probability, number sets, standard distribution, and two-way tables but not trigonometry. I use it as an assessment for the students I home-school and study guide for students in public or private school settings. The first section involves matching graphs, key terms/skills, and parent equations to the various functions introduced in Algebra 2. The voc
Subjects:
Grades:
10th - 12th
CCSS:
Also included in: Algebra 2 Bundle
Showing 1-12 of 12 results

