258 results
Graphing centers for Easel
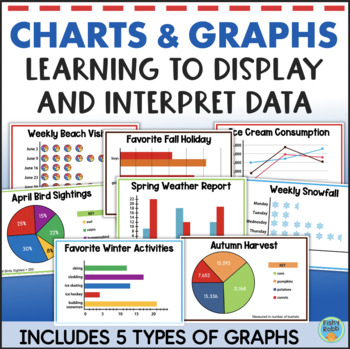
Math Graphing Activities Interpreting Graphs and Data Worksheets Line Pie Bar
Representing and interpreting data using graphs and charts is the focus of this math resource for upper elementary grades. It helps students explore and understand data analysis. For each activity, students will use a graph to answer questions about the data. They will also create another type of graph, chart, or table based on the information provided. This added step really helps students understand the various types of graphs and ways in which data can be displayed.These activities are perfec
Subjects:
Grades:
3rd - 5th
Types:
Also included in: Third Grade Math & Reading YEAR LONG BUNDLE 1500+ Pages
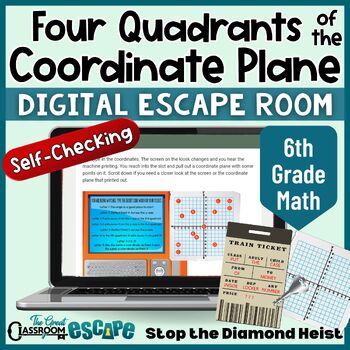
Four Quadrants of the Coordinate Plane Digital Escape Room 6th Grade Math
Can your students solve problems in all four quadrants of the coordinate plane in order to recover stolen diamonds? Students will race through a train station following clues, plotting points, solving word problems, as they go undercover to recover the goods stolen in a diamond heist. This online breakout is based on 6th grade math standards. They'll need to be quick reflecting points across the x-axis, finding the distance a point lies from the y-axis, finding the distance between points, and p
Subjects:
Grades:
5th - 7th

Coordinate Plane Digital Escape Room Activity 5th Grade Geometry First Quadrant
Set the fifth grade coordinate plane worksheets aside and try this digital escape room involving plotting points, interpreting word problems, graphing ordered pairs, and solving problems in the first quadrant of the coordinate plane. For this low prep 5th grade geometry activity, students race to catch a flight and fill in the information on their "plane tickets." Print a ticket and coordinate plane (included in the PDF) for each student, then the rest of the escape room is fully automated. Stu
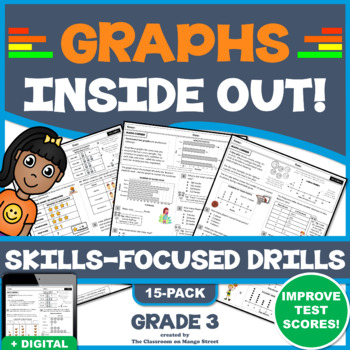
3RD GRADE GRAPHS: BAR, PICTURE, & LINE PLOTS - 15 Skills-Boosting Worksheets
Students will complete word problems related to bar graphs, pictographs, line/dot plots and tally charts. This includes reading and interpreting data, performing calculations, matching data to and representing data in graphs. Use these scaffolded math drills to teach and reinforce the fundamentals, or prep for test day. Each drill begins with a mini-lesson followed by several Common Core designed, simulated test questions (including multi-part & open response). These practice worksheets
Subjects:
Grades:
3rd - 4th
Types:
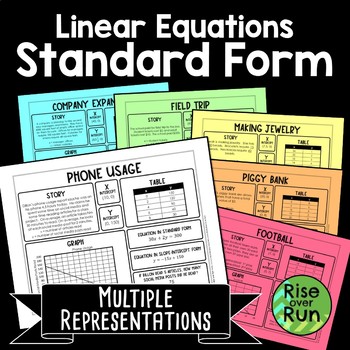
Graphing Linear Equations in Standard Form Real World Tasks
Help your students make sense of linear functions in standard form with these practice sheets. Students will see how equations, graphs, tables, and word problems all connect! 6 tasks are provided where students fill in missing information. They complete:a storya graphinterceptsa tablean equation in standard forman equation in slope-intercept formand answer a question about the scenarioEach of the 6 sheets provides just enough information so students can figure out the rest! A blank template i
Grades:
8th - 9th
Types:
CCSS:
Also included in: 8th Grade Math Activities & Lessons Bundle for the Whole Year
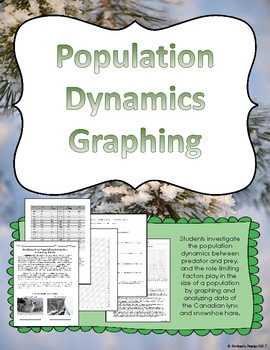
Predator and Prey Population Dynamics Graphing Activity
Students investigate the population dynamics between predator and prey, and the role limiting factors play in the size of a population by graphing and analyzing data of the Canadian lynx and snowshoe hare.I use this activity with my sixth grade students during our unit on ecosystems. We complete it as a class activity. You could make it an option in a choice project, a learning extension for higher level students, or an activity for a science center.The final page includes the completed graph
Grades:
5th - 8th
Types:
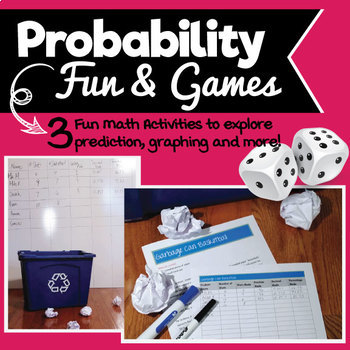
Probability Fun & Games! Exploring fractions, decimals, percentages & more!
Probability Fun & Games reinforces the concepts of: addition, prediction, graphing, fractions, decimals, and percents through three fun activities. Your students will be on the fast track to learning basic math skills. The packet include three activities - Roll Them Bones, Trash Can Basketball and What Color is Your Candy.
Included in this download are:
• Note to teacher with tips on using lessons
• Three activities with instructions
• Discussion prompts
• Ready-made charts for students to
Subjects:
Grades:
3rd - 8th
Types:
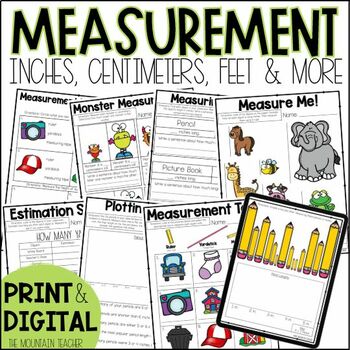
Measurement Worksheets, Anchor Charts & Assessments for 2nd Grade
Need some helpful measurement worksheets and anchor charts for your 2nd grade students? This 2 week unit is filled with printable and digital measurement worksheets, assessments and hands-on activities covering using a ruler, inches, centimeters, comparing lengths, length, width, height, estimating, line plots, selecting the correct tool, and more.What's Included in the Measurement Worksheets:23 Page Digital Workbook (9 Printable Worksheets PDF)Digital/Printable Pre and Post TestTeaching GuideAn
Subjects:
Grades:
1st - 3rd
Types:
Also included in: 2nd Grade Math Worksheets and Lessons YEAR BUNDLE Print and Digital
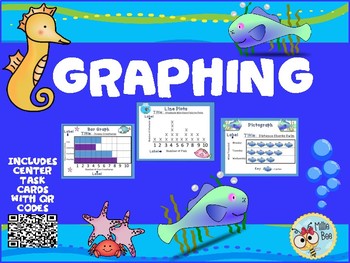
GRAPHS- Bar Graphs - Pictographs - Line Graphs -2nd grade -Print and Digital
Lots of graphing practice with this ocean themed unit. This hands on unit includes bar graphs, pictographs, and line plots for lots of student graphing practice. Students will interpret graphs and create their own. Included are 4 posters, two practice worksheets for each type of graph, and a separate section for center activities with QR codes. The center activities include 4 separate graphs with 16 task cards with QR codes. Answer key is included. A QR reader is not necessary since an answer
Grades:
2nd
Types:
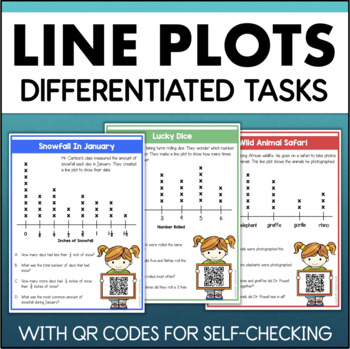
LINE PLOT Practice Activities with Fractions & Data Task Cards Worksheets
This math resource provides a scaffolded introduction to using line plots for organizing and interpreting data. The activities move from simple categorial data to more complex line plots with fractions.Each full-page card includes a data set presented in a line plot, along with 4 questions for students to answer. These questions require students to interpret and compare the data. FEATURES OF THIS RESOURCE:differentiatedability to self-checkdigital versionINCLUDES:There are 15 line plot cards div
Subjects:
Grades:
2nd - 4th
Types:
Also included in: Third Grade Math & Reading YEAR LONG BUNDLE 1500+ Pages
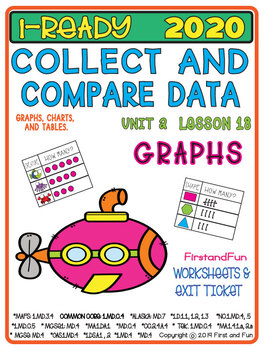
COLLECT AND COMPARE DATA GRAPHS TALLY MARKS OBJECTS READY MAF 1st Grade Math
TALLY GRAPHS AND PICTURE GRAPHSProduct DescriptionThis math pack is a great addition to any Math Curriculum for first grade. This product has extensive practice for students who are learning to understand how sort and compare object (with addition and subtraction equations) how to read complete tally and picture graphs. There are opportunities to compare data utilizing word problems.This pack is a great addition to any Math Curriculum for kinder and first grade. There are 29 differentiated works
Subjects:
Grades:
K - 2nd
Types:
Also included in: iReady 2020 Update Bundle - Supplemental Resources for 1st Grade Math
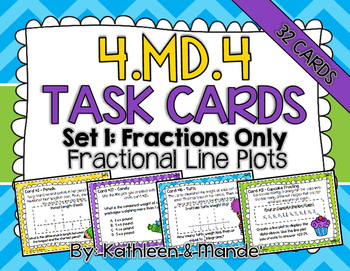
4.MD.4 Task Cards: Fractional Line Plots {Set 1: Fractions Only}
Looking for a fun, engaging way for your students to practice creating and interpreting fractional line plots? Your students will love practicing with these adorable, easy to use task cards. These 32 task cards are aligned to CCSS 4.MD.4: Fractional Line Plots.Do you want to assess the quality of our task cards before you buy? Try our {FREEBIE} 4.NF.7 Task Cards: Compare & Order Decimals. - - - - - - - - - - - - - - - - - - - - - - - - - - - - - - - - - - - - - - - - - - - - - - - - - - - -
Subjects:
Grades:
3rd - 5th
Types:
Also included in: 4.MD.4 BUNDLE: Fractional Line Plots
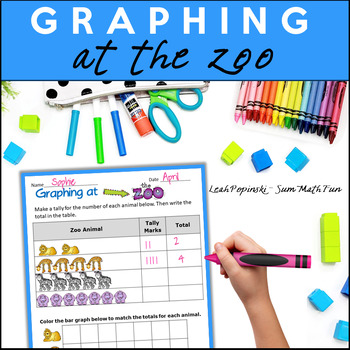
Zoo Animals Graphing Math Worksheets & Activities -A Zoo Field Trip PBL Activity
Are you taking a field trip to the zoo? You and your kids will LOVE these activities! They are PACKED with wildly cute animals and irresistible graphing worksheets! These No Prep Printables (also in the TpT Easel format!) will strengthen your students’ graphing skills using tally marks and bar graphs horizontally as well as vertically. And, the cute graphics are super motivating! See complete sample pages in the preview.⭐AS A HUGE TIME-SAVER FOR YOU - A COMPLETED EASEL VERSION IS INCLUDED IN YOU
Subjects:
Grades:
1st - 2nd
Types:
CCSS:
Also included in: Zoo Animals Activities Bundled | Zoo Graphing & Zoo Bingo Game
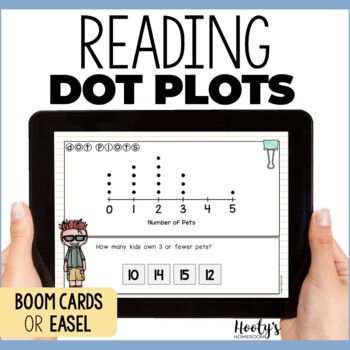
Dot Plot Digital Activities - 3rd Grade Line Plot Boom Cards & Easel Practice
Understanding dot plots can be tricky! Give your students the line plot practice they need to master this skill. These line plot digital task cards are perfect for 3rd grade students who are learning about dot plots. Boom Cards and Easel activities are self-checking and give students immediate feedback so they can improve as they practice. More options!These dot plot activities have been updated to give you more options. You can choose from BoomCards, Easel Activities, and Easel Assessments. The
Grades:
3rd - 4th
Also included in: 3rd Grade Math Boom Cards Bundle
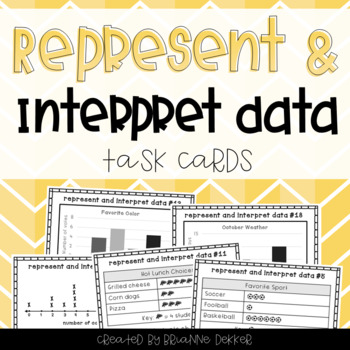
Represent and Interpret Data Task Cards
These 24 task cards target representing and interpreting data, aligned with the Grade 3 GoMath curriculum, Chapter 2. They include practice with reading and creating picture graphs and bar graphs as well as solving problems based on data, graphs, and line plots.
A recording sheet and answer key are included.
***
You might also be interested in:
- Represent and Interpret Data worksheets - $1
- Graphing the Weather Worksheets and Projects - $2
Would you like credit for future purchases?
Don'
Subjects:
Grades:
2nd - 4th
Types:
CCSS:
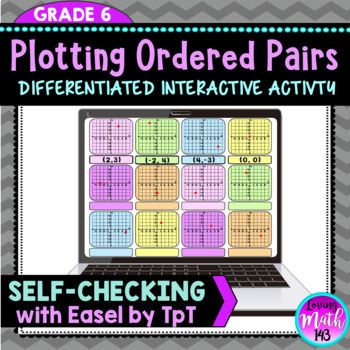
Graphing on the Coordinate Plane (4 quadrants) Self-Checking Digital Activity
Middle school math students will practice plotting ordered pairs on the coordinate plane. Students will plot 12 ordered pairs on the coordinate plane in all four quadrants. This activity is DIFFERENTIATED with two versions for your higher level and lower level students. Simply Create a Copy and delete the unnecessary slides depending on the population! ★BONUS FEATURE★This product is also available on Easel by TpT! This means, students can "Drag and Drop" their answers for a self-checking experie
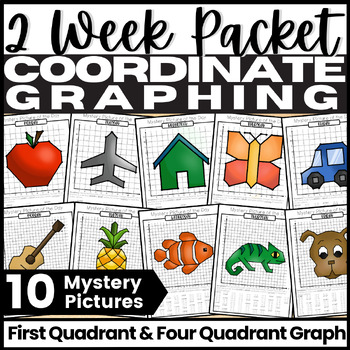
Coordinate Plane Mystery Pictures, First Quadrant and Four Quadrant Graph
If you're looking for highly engaging Coordinate Plane Mystery Pictures for your students, This. Is. It. This packet includes 10 Mystery Pictures and is differentiated by giving you the option of assigning Quadrant 1 Graph and/or all 4 Quadrants Graph. Get your students excited for math with this fun Coordinate Plane Mystery Picture of the Day Packet! This is a must-have packet for your Coordinate Graphing Unit. How is this Coordinate Plane Mystery Pictures Packet different from other Graphing a
Grades:
5th - 7th
Types:
CCSS:
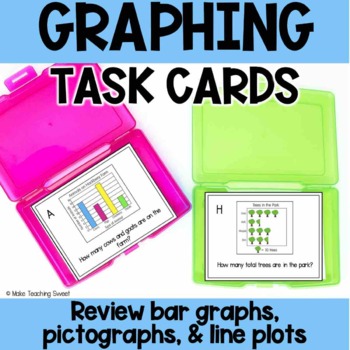
Graphing Task Cards - Interpreting Bar Graphs, Picture Graphs, Line Plots
Interpreting data doesn't have to be boring! Add these engaging task cards to your graphing unit! The task cards review bar graphs, pictographs, and line plots using these graphing task cards! Perfect to use as a whole group review, with a small group or in a math center. Teaching students to analyze data on graphs can be such a fun unit - but using the same graphs gets boring! Each task card features a different graph so your students will have a fun, hands-on way to practice reading graphs an
Subjects:
Grades:
1st - 4th
Types:
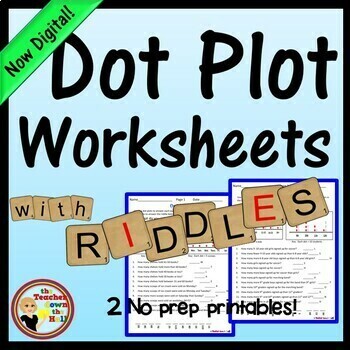
Dot Plots Worksheets with Riddles Data Analysis Activities Print & Digital
Need a fun way to practice analyzing Dot Plots? This is a set of 2 self-checking worksheets - each with a riddle to solve. Students will analyze dot plots and add, subtract, or mult to solve problems. Then they will match their correct products to answer a riddle at the bottom of each worksheet. Don't want to print? Students may now complete this assignment as an EASEL activity!**Here's What's included:2 self-checking worksheets with 2 dot plots on each. Students will solve the riddle by an
Subjects:
Grades:
4th - 5th
Types:
CCSS:
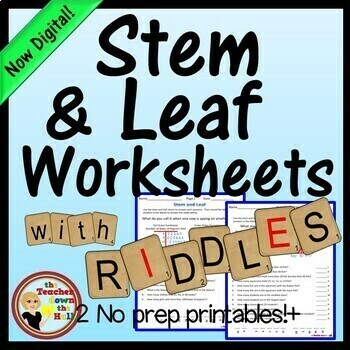
Stem and Leaf Plots Worksheets with Riddles I Data Analysis Activities
Need a fun way to practice analyzing stem and leaf plots? This is a set of 2 self-checking worksheets - each with a riddle to solve. Students will analyze stem and leaf plots to answer questions. Then they will match their correct answers to solve a riddle at the bottom of each worksheet. Use as a fun homework assignment, a self-checking independent practice, or allow students to race to find the answer to the riddle! Don't want to print? Students may now complete this assignment as an EASEL
Subjects:
Grades:
4th - 5th
Types:
CCSS:
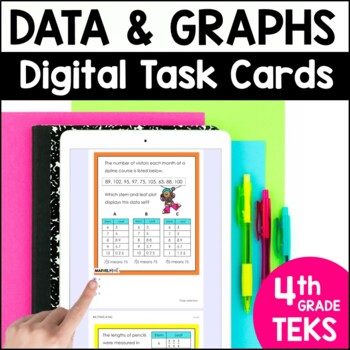
4th Grade Data Analysis, Dot Plots, Stem and Leaf Plots - Online STAAR Review
Save time with these fun and engaging Digital Task Cards for Dot Plots, Stem and Leaf Plots and Frequency Tables. These Dot Plot activities and Stem and Leaf Plot graph tasks are perfect for math centers, morning work or online STAAR review. This is a No Prep resource, to save you time!This resource includes 24 TEKS-aligned Digital Task Cards for Data Analysis and Graphs that can be assigned for Math Station Work, Homework, or online STAAR Review. This resource is included in 2 forms: a Google
Subjects:
Grades:
4th
Types:
CCSS:
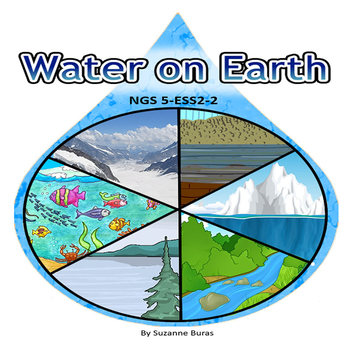
NGS 5-ESS2-2 Water on Earth
This product provides supplemental resources that address concepts related to describing and graphing the amounts and percentages of water and fresh water in various reservoirs to provide evidence about the distribution of water on Earth.The product includes the breakdown by percentages of the categories of water found on earth. It further breaks down each category into subcategories. For each, students are asked to graph the percentages. There is also a research opportunity related to drink
Subjects:
Grades:
4th - 6th
Types:
NGSS:
5-ESS2-2
Also included in: Next Generation Science: Earth Science Bundle 5-ESS1-3
Halloween Coordinate Grids
Halloween Math Coordinate Grid Activity- Common Core Standard 5.G.A.1 - a fun, Common Core Standards-aligned Halloween math activity. Students plot coordinates on a grid to reveal Halloween related images. There are three different images to graph, each increasing in difficulty. These would look great on a Halloween math bulletin board, or could be used as a math center or whole class activity. Aligns to Common Core Standard 5.G.A.1.NEW: Digital Easel activity included!! Students can drag &am
Subjects:
Grades:
4th - 6th
CCSS:
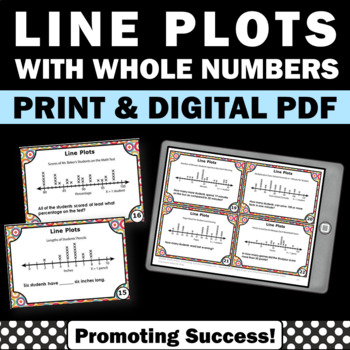
Line Plots Measurement Activities Interpreting Data and Charts Math Task Cards
DIGITAL PDF AND PRINTABLE PACKET: You will download 30 task cards (digital and print) for your 2nd or 3rd grade students to practice interpreting line plots with whole numbers. You may use the printable task cards in math centers or stations for fun practice and review games and activities, such as a scavenger hunt or SCOOT. They also work well for transition activities, as exit tickets, for morning work, and as quick formative assessments. Game ideas, a student response form and answer key are
Subjects:
Grades:
2nd - 3rd
Types:
CCSS:
Showing 1-24 of 258 results


