🎉 Teacher Appreciation: Save up to 25% using promo code THANKYOU24. Sale ends in 1 hrs 30 min. Learn more
161 results
Graphing rubrics
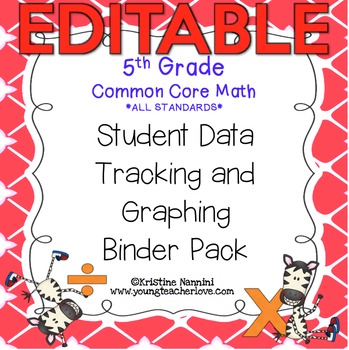
Student Data Tracking Binder - 5th Grade Math - Editable
These Student Data Tracking Binders are an easy-to-implement system. Put students in charge of tracking their own learning and data! With this Student Data Tracking Binder, your students will monitor their own growth and progress using standards based assessments (also found in my store), rate and date their learning using Marzano's Levels of Thinking/Understanding, and keep track of "I can" statements or learning targets as they progress through the Common Core Standards. This resource is now e
Subjects:
Grades:
5th
Types:
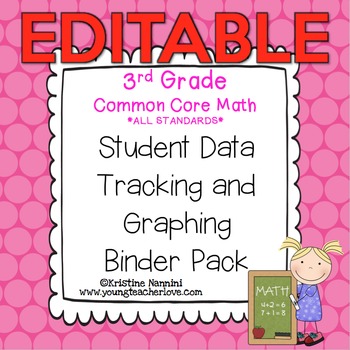
Student Data Tracking Binder - 3rd Grade Math - Editable
These Student Data Tracking Binders are an easy-to-implement system. Put students in charge of tracking their own learning and data! With this Student Data Tracking Binder, your students will monitor their own growth and progress using standards based assessments (also found in my store), rate and date their learning using Marzano's Levels of Thinking/Understanding, and keep track of "I can" statements or learning targets as they progress through the Common Core Standards. This resource is now e
Subjects:
Grades:
3rd
Types:
Student Data Tracking Binder - 4th Grade Math - Editable
These Student Data Tracking Binders are an easy-to-implement system. Put students in charge of tracking their own learning and data! With this Student Data Tracking Binder, your students will monitor their own growth and progress using standards based assessments (also found in my store), rate and date their learning using Marzano's Levels of Thinking/Understanding, and keep track of "I can" statements or learning targets as they progress through the Common Core Standards. This resource is now e
Subjects:
Grades:
4th
Types:
Student Data Tracking Binder - 6th Grade Math - Editable
These Student Data Tracking Binders are an easy-to-implement system. Put students in charge of tracking their own learning and data! With this Student Data Tracking Binder, your students will monitor their own growth and progress using standards based assessments (also found in my store), rate and date their learning using Marzano's Levels of Thinking/Understanding, and keep track of "I can" statements or learning targets as they progress through the Common Core Standards. This resource is now e
Subjects:
Grades:
6th
Types:
Student Data Tracking Binder - 2nd Grade Math - Editable
These Student Data Tracking Binders are an easy-to-implement system. Put students in charge of tracking their own learning and data! With this Student Data Tracking Binder, your students will monitor their own growth and progress using standards based assessments (also found in my store), rate and date their learning using Marzano's Levels of Thinking/Understanding, and keep track of "I can" statements or learning targets as they progress through the Common Core Standards. This resource is now e
Subjects:
Grades:
2nd
Types:
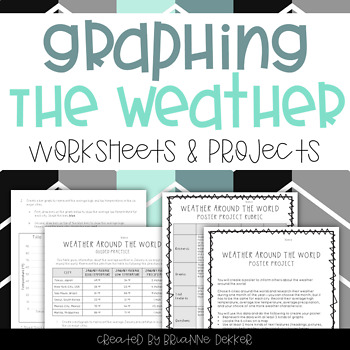
Graphing the Weather - Worksheets and Projects
This product contains science and math graphing worksheets and projects for a unit on weather. These resources were created with NGSS content and evidence statements in mind.
The first set of worksheets focus on weather around the world, and the second set focus on weather patterns in one area. Each set contains guided practice, in which students are given data and asked to create different types of graphs to represent the data; independent practice, in which students must gather data and then
Subjects:
Grades:
3rd - 5th
Types:
FRENCH Data Management Unit Plan - Grade 2
This Math Data Management Unit Plan was created for Grade 2 French Immersion and aligns with the Ontario Math Curriculum. It includes:Unit plan composed of 19 detailed lesson plansUnit vocabulary listWorksheetsGraphing games and fun activitiesA list of simple and higher level sentence prompts used to analyze data. Bar graph criteria mini-checklistsTemplates for every type of graphPages you may project on the whiteboard or document camera to use for a lesson.1 Mini-assessment and 1 test with corr
Grades:
2nd
Types:
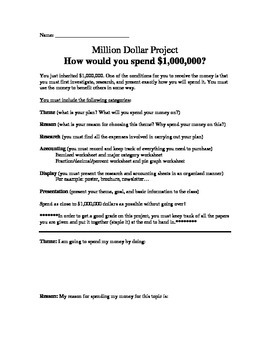
Million Dollar Project (Graphing, decimals, fractions, accounting and percents)
What would you do with a million dollars? How would you spend it?
In this project you've been left a 1 million dollar inheritance. The catch is you must first research and present how you will spend the money.
In the first part of the experiment, the students will fill out an accounting chart, where they will fill out an itemized chart displaying each item they plan on purchasing to complete their million dollar project. They will than be asked to put all those items into major categorie

Fluency Graphs (Monster Readers Theme)
Monster Readers Fluency Graphs--
Monitor your monster readers' fluency progress!
Great for record-keeping and data management!
In this packet, you will find:
* About Fluency & Tracking Progress (basic facts)
* Background Info on Timed Reading, Target Charts & Recording Sheets
* 5 Different Graphs: 60, 100, 120, 150 plus blank one to write in goal targets
* A class profile sheet
* Fluency Rubric
* Fun partner recording sheets
* 2 Award Sheets for meeting goals (one color, one b/w--half
Subjects:
Grades:
K - 4th
Types:
Also included in: Reading and Writing Super Mega Bundle Deal
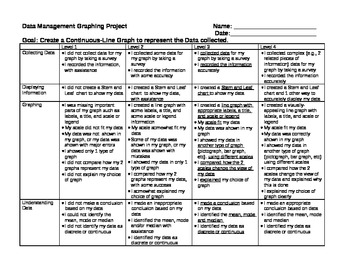
Grade 6 Graphing Project Rubric - Ontario
This is a rubric for a graphing project based on the Grade 6 Ontario Curriculum. It covers all points from the Grade 6 Data Management related to graphing (not probability), EXCEPT - determining how well the data represents a bigger population.
Download the preview to see a sample that one of my students made.
The project I did with my class was:
-collect data by doing a sample, research or experiment
-create a tally chart, stem and leaf plot, and t-chart showing the data
-create a continuou
Grades:
6th
Types:
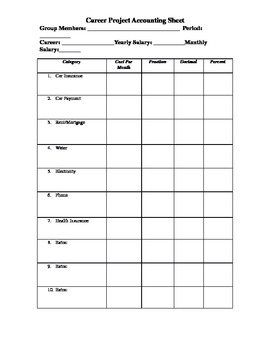
Career Monthly Bils Circle Graph Project
In this project students draw a career and select 10 of their monthly bills. They then figure what percent of their monthly salary goes to each item and create a circle graph showing where their money goes. The file you will receive includes a rubric for the project, an accountability sheet, 24 "career cards", a list of choices for the 7 required and 3 choice items in the project, and teachers notes about how the project has been made successful in their class. It is a word document so any of th
Subjects:
Grades:
6th - 8th
Types:
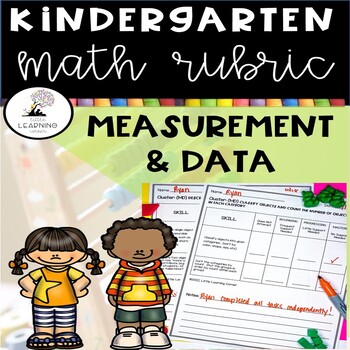
Kindergarten Math Rubric MEASUREMENT AND DATA | Assessments
A kindergarten rubric or assessment tool for the Common Core domain, Measurement and Data. Document students skill ability ranging from No Effort to Mastered: No Support Needed.CONTENTS1 rubric for the cluster- Describe and compare measurable attributes1 rubric for the cluster- Classify or sort objects and tell how many objects are in each category.Great tool to record students progress. Use during observation in centers, activities, or after completing formal assessments. Copy and share with
Subjects:
Grades:
K, Staff
Types:
Also included in: Kindergarten Math Rubrics Bundle | Assessments Data Collection
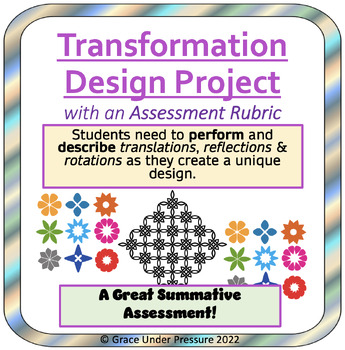
Transformation Geometry Project with an Assessment Rubric: Gr 6-8 Geometry
This creative and fun math geometry project assesses students’ ability to perform and describe 3 kinds of transformations: translations, rotations, and reflections. It is a great summative assessment for your transformation unit!It will take several work periods for students to create their design and write or type a detailed explanation of the process. This is how I can really see if they understand the concepts. I encourage students to describe their process using specific mathematical vocabul
Subjects:
Grades:
6th - 8th
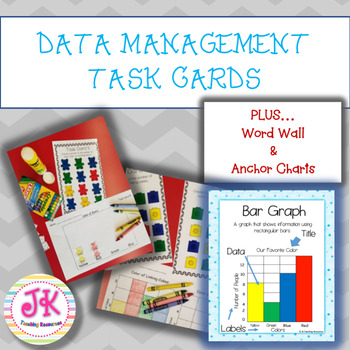
Data Management & Analysis Bundle-Pictograph | Bar Graphs | Tally Marks |
This data management bundle is loaded with over 40 pages of task cards, anchor charts, rubrics AND a word wall! All of which requires very little to NO PREP! It was designed to help teachers teach, reinforce, practice, and assess students’ understanding of the data management/analysis unit.Our focus was on Grade 2, 3 and special education classrooms when we made this product but it does align with Kindergarten and Grade 1 standards or make a good review in elementary classrooms. Especially for b
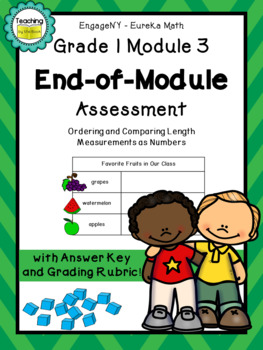
Eureka Math First Grade Module 3 End-of-Module Assessment
This product aligns with EngageNY - Eureka Math Grade 1 Module 3. It is a comprehensive assessment of the module on Measurement, Data, and Graphing. Students will be evaluated on these standards by organizing a given set of data and answering questions based off of that data. Students will also be assessed on measurement skills by using centimeter cubes to measure pictures and answer questions based off of those measurements. This product includes: Pages 1 & 2 - Cover & Teacher NotesPag
Subjects:
Grades:
1st
Types:
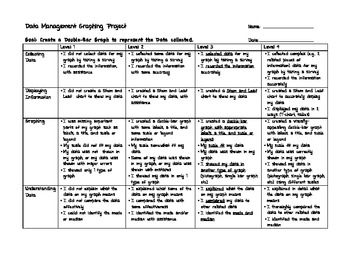
Grade 4 Graphing Project Rubric - Ontario
This is a rubric I created based on the Grade 4 Ontario Curriculum. It includes all specific expectations for Data Management related to graphing (not probability).
The preview is a sample that one student created. He left the bottom blank to print out a picture of LeBron!
I used this to assess a final data management project my class did. Each student had a bristol board and had to:
-collect data through a survey or experiment
-show their data in a tally chart, stem and leaf plot and t-ch
Grades:
4th
Types:
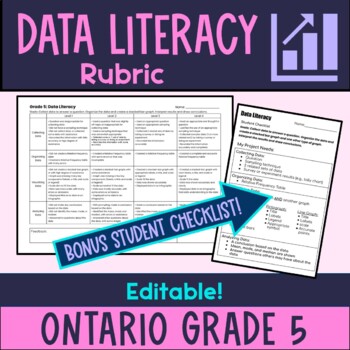
Grade 5 Data Literacy: Graphing Rubric - Ontario
This is a rubric and student checklist for a Grade 5 graphing unit project, based on the 2020 Ontario Math Curriculum for Data Literacy. Save time with this ready-made rubric to make your grading easier. It's also editable in Google Docs, so you can change it to suit your needs and focus. Includes expectations for:collecting dataorganizing data visualizing dataanalyzing data.This rubric will save you time as you grade your students learning throughout your data literacy unit on graphing. Student
Grades:
5th
Types:
First Grade Math Rubric | Measurement and Data Assessments
First grade rubric or assessment tool for the Common Core Math Standards. This rubric is for the Measurement and Data domain.The skills include:Measure lengths indirectly and by iterating length units.Tell and write timeRepresent and interpret dataCONTENTS1 Rubric for Measure lengths indirectly and by iterating length units.1 Rubric for Tell and write time1 Rubric for Represent and interpret dataGreat tool to record students progress, add to progress reports or report cards. Use during observat
Subjects:
Grades:
1st
Types:
Also included in: First Grade Math Rubrics Bundle | Assessments Data Collection

Math Project Linear and Exponential Functions Which Salary? *DISTANCE LEARNING
PRINT and DIGITAL * * Makes distance planning so much easier!Linear and Exponential Functions Math Project: Which Salary Would You Choose?Are you looking for a way for you students to show you they can model linear and exponential functions with a real world application? Linear and Exponential Functions Math Project: Which Salary Would You Choose?, is just what you need. TPT buyer said, "Great resource".In this project students will model salary situations involving linear and exponential func
Mathematics in Nature {CCSS Math and NGSS Aligned}
Students explore and apply the principles of mathematical patterns in nature in a fun and engaging way! First, students identify and describe patterns in the natural world before heading outside to find patterns on their own. Next, students begin to explore number patterns in nature using the Fibonacci sequence. Fin fingerprint activity keeps students interested and engaged! Next, explore cycles in nature by creating a model on paper using 3-dimensional objects. Rubric included. Students are
Grades:
4th - 7th
Types:
Collecting, Organizing and Interpreting Data Assignment -Data Management Digital
In this culminating task, students will create a survey question, organize their data using frequency tables, graph their data and interpret their results. They will also find the mean, median, mode and range of the data.This is assignment asks students to create a presentation that will include the following:A survey questionMean, Median, Mode and Range of the dataFrequency table for the data3 different visual representations of their findingsInterpretation of the resultsThis product includes
Grades:
4th - 8th
Types:
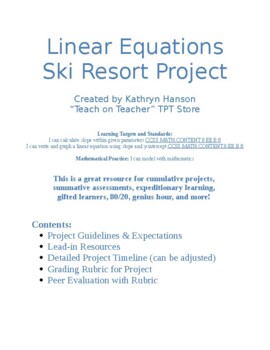
Linear Equations Ski Resort Project w/ Timeline, Rubrics, & Peer Evaluation
Get ready to see students amaze you with their high-quality work as they demonstrate their learning of linear equations and functions. Students will design and create a model of a ski resort, using y = mx + b to construct 2-D and 3-D ski slopes! This project is great for general education classrooms, differentiated groupings, gifted learners, expeditionary learning, cumulative and summative assessments, genius hour, 80/20, passion projects, and so much more! What's best is it reaches all learnin
Grades:
7th - 10th
Types:
CCSS:
Math Project Graphing Systems of Equations Math & Art Project *DISTANCE LEARNING
PRINT and DIGITAL * * Makes distance planning so much easier!Graphing Systems of Equations Math and Art ProjectYour students will apply their skills of graphing systems of linear equations with art! Students will graph specified types of systems of linear equations and choose how they create an original piece of art. My students love this project because it provides an opportunity for them to be creative in math class!This project is a great formative assessment because it assesses students’ s
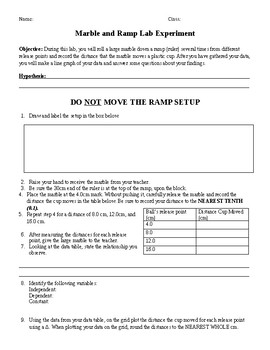
Ball and Ramp
This lab test students knowledge of the scientific method, graphing skills, forces and motion.
This lab includes a step by step procedure for performing and recording data to create a graph. Student must read carefully through the procedure to complete the task. They must be able to draw and label the setup, identify variables, state a relationship and setup a graph.They must understand to EXTRAPOLATE and INTERPOLATE from the graph they created. Finally they must use their knowledge of forces
Grades:
6th - 8th
Types:
Showing 1-24 of 161 results


