698 results
Graphing homeschool curricula
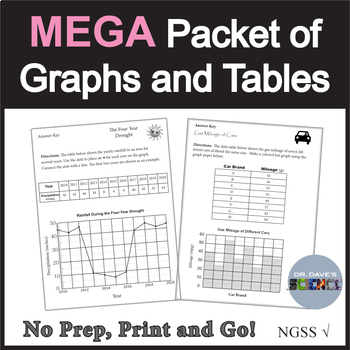
5th Grade Science Test Prep NGSS Science Review, Data Tables and Graphing
A huge collection of 37 science graphing activities from all my elementary science units. Great for 4th and 5th grade science review, an independent work packet, or as a folder for science substitute lesson plans. Here is the perfect resource to help your students become experts in graphing! Covers life, earth and physical science topics. The packet is a collection of ready-to-go practice graphing worksheets and data tables sure to help your students master graphing skills. Some of the science
Subjects:
Grades:
3rd - 5th
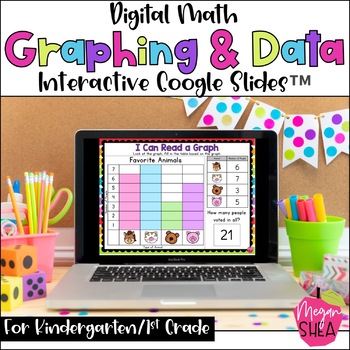
Kindergarten Math Digital Graphing and Data for Distance Learning Google
These interactive Google Slides are perfect for distance learning. These slides can be used on Google Classroom. This product would be perfect for kindergarten and first grade. Most students will be able to complete these activities independently. This would also be great for homeschool and virtual school.This product includes 10 Google Slides for students to complete digitally. The slides can be done on any device, your students will just need a Google Account. You can also use these as a whole
Grades:
K - 1st
Types:
Also included in: Kindergarten Digital Math Google Slides for Distance Learning
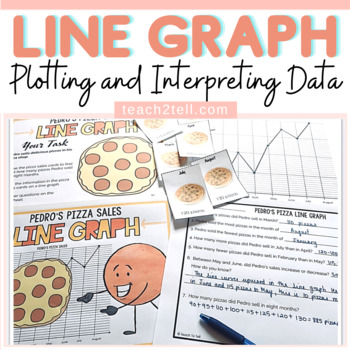
Line Graph Activity | Plotting and Interpreting Data on a Line Graph
Looking for a line graph activity that involves plotting and interpreting data on a line graph? Your students will enjoy this hands-on center activity that involves recording pizza sales over a given period using card visuals. They will get to plot and interpret data on a line graph.Items IncludedFile folder cover (2 options): if placing all items in a file at a centerSingle large task card (color and blackline) on a sheet outlining the taskTwo small task cards (color and blackline) on a sheet o
Subjects:
Grades:
2nd - 5th
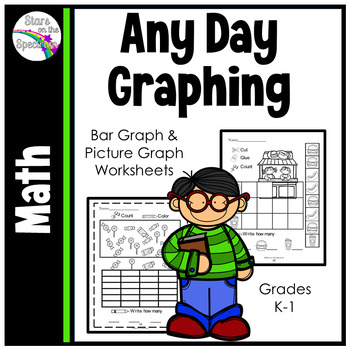
Bar Graphs and Picture Graph Worksheets Printables
You and your students will love these Print and Go Bar Graph and Picture Graph Activities. A variety of formats are provided to give students an opportunity to practice collecting, comparing and organizing data.Practice can be easy with 22 No Prep Worksheets and easy check Answer Keys. No more searching for the right skill and matching to the season or holiday. These graphing worksheets sheets can be used any day! Just check the table of contents for the skill you need. The clip art is appropria
Grades:
K - 2nd
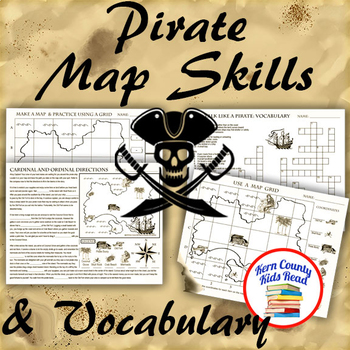
Pirate Map Skills: Grid Coordinates, Cardinal & Ordinal Directions, Symbols
Teach and strengthen coordinate grid math, geography mapping skills like map symbols and cardinal and ordinal directions with a compass rose, and new vocabulary with these pirate themed printable worksheets. These are fun mini-lesson activities for Talk Like A Pirate Day on September 19th or if you have a pirates themed unit. Cardinal directions and coordinate grid mapping are important introductory skills to mastering latitude and longitude map skills and being able to use an atlas. Coordinate
Subjects:
Grades:
3rd - 6th
Also included in: Pirates Thematic Unit Study Bundle: Talk Like A Pirate Pack!
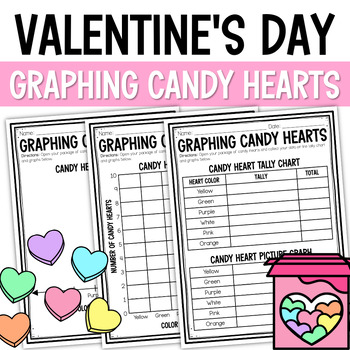
Valentine's Day Graphing Candy Hearts, Conversation Heart Graphing, Candy Graph
Valentine's Day Graphing Candy Hearts, Conversation Heart Graphing, Candy GraphThis is the perfect Valentine's Day Activity for both classroom and digital at-home learning! This interactive Valentine's Day math graphing activity is engaging and helps students practice drawing tally charts, picture graphs, and bar graphs. You'll be shocked at how excited students will be to graph candy hearts! This product includes practice in the following areas:Tally ChartsPicture Graphs (Pictographs)Bar Graphs
Subjects:
Grades:
K - 2nd
Also included in: 2nd Grade Valentine's Day Math and Language Review Worksheet Bundle
Algebra 1 Curriculum
Get a complete High School Algebra 1 curriculum including units on solving equations and inequalities, linear functions, exponents and exponential functions, factoring polynomials, quadratics, and more! These ready-to-use Algebra 1 resources include everything you need to teach high school algebra to your on-level or lower-level/special education class. Supplements would be needed for an honors class.Each unit contains guided notes, practice worksheets for the classroom and/or homework, activiti
Grades:
8th - 11th
CCSS:
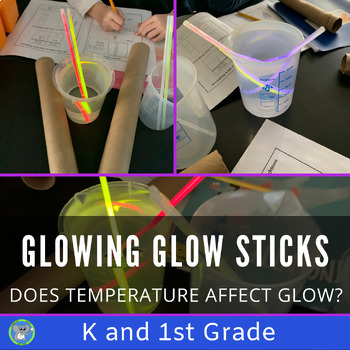
Glow Stick Light Experiment | Grade K 1 2 Chemical Reaction Science Activity
Excite students by investigating how temperature affects the brightness of glowsticks. This experiment uses simple supplies and includes detailed directions to guide the teacher and students. NGSS Aligned, fun, and perfect for Halloween.Students will follow the scientific method to answer the question:Does temperature affect the brightness of a glow stick? The journal meets the K-2 Science and Engineering Practices in NGSS.Teachers will like its’ ease of use, simple materials, and background inf
Subjects:
Grades:
K - 2nd
NGSS:
K-2-ETS1-3
, 1-PS4-2
Also included in: Chemical Reaction Bundle | The Science Of Glow Sticks | Light Activity
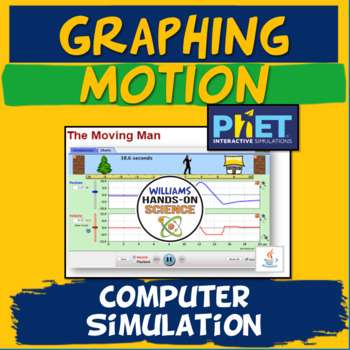
Graphing Motion MS-PS2-2: PhET Simulation: Moving Man Activity
Moving Man is a great way for your students to understand graphing motion and have fun while doing it! I’ve done this lab for years and my students are always engaged and have a much greater grasp of how motion looks on a graph. PhET simulations are my go-to when it comes to online simulations. You will need a computer and the correct software (system requirements: https://phet.colorado.edu/en/help-center/running-sims).You get the key and 4 pages of simulations and questions that involve the stu
Subjects:
Grades:
6th - 12th
Types:
NGSS:
MS-PS2-2
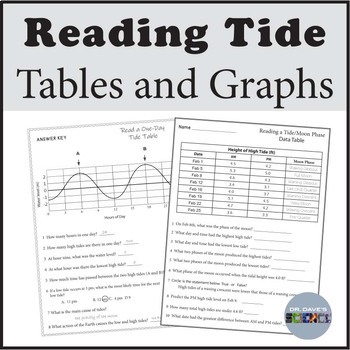
Tides Graph and Table Activity Tide Worksheets and Charts
A set of four graph and data table worksheets when studying the tides. There are two reading tide graph worksheets, a reading data table worksheet associated with the phases of the moon, and a graphing activity where students construct a line graph using tidal data. All come with answer keys. Integrated Tide Art ActivityTerms of Use Copyright © Dr. Dave’s Science. All rights reserved by author. This product is strictly for individual use and may not be copied or given to other teachers. Copying
Subjects:
Grades:
4th - 6th
NGSS:
MS-ESS1-1
Also included in: Solar System Activities Worksheet Unit Bundle Inner Outer Planets
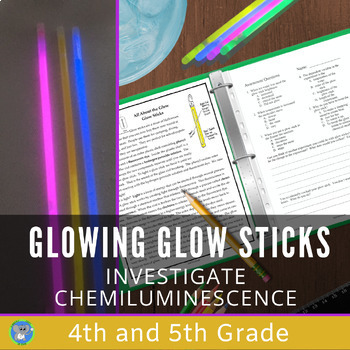
Chemical Reactions Glow Stick Science | Investigate Light | Grade 4 5
Excite students by using glowsticks to investigate chemiluminescence and the speed of a chemical reaction. This experiment uses simple supplies, includes detailed directions to guide the teacher and students, and creates a memorable experience. NGSS Aligned, fun, and perfect for Halloween.Students will discover chemiluminescence and the speed of a chemical reaction. They will follow the scientific method to answer the question: Does temperature affect the brightness of a glow stick? The journal
Subjects:
Grades:
4th - 6th
NGSS:
5-PS1-3
, 3-5-ETS1-3
, 4-PS3-3
, 5-PS1-1
, 4-PS3-2
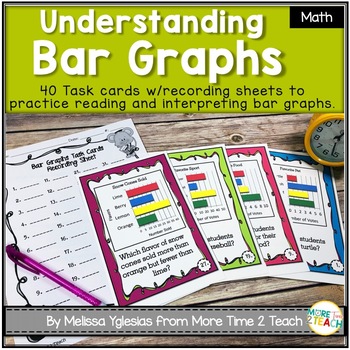
Graphing and Data: Bar Graphs Task Cards
Help your students develop proficiency reading and understanding bar graphs with these 40 MATH TASK CARDS! Each printable page includes 2 large task cards making it easy for students to analyze each graph. Use these task cards to teach/practice the fundamental skill or prep for test day!THIS PRODUCT INCLUDES:*40 task cards focusing on solving one and two-step problems using the information presented in scaled bar graphs. *student recording sheet*answer keyUSEFUL IN MANY WAYS!Once printed and lam
Subjects:
Grades:
2nd - 5th
Also included in: Graphing Task Cards Bundle
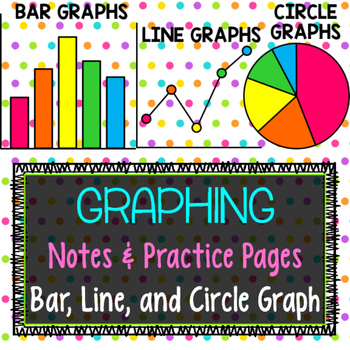
Graphing BUNDLE
Graphing is an important part of connecting math, science, STEM, etc. This bundle of resources will help your students learn and practice the skills of deciphering which type of graph would work best for the data given and then how to properly create bar, line, and circle graphs.
This bundle (discounted at 20%) includes notes, practice pages, activities, and an interactive word wall. Please click on each product listed for further details or if you'd like to purchase them separately.
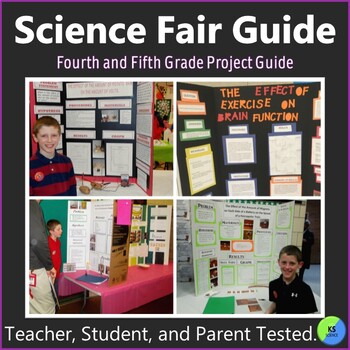
Science Fair Project Guide | Experiment Journal and Worksheets For Grade 4 And 5
A step by step science fair guide with workbook pages, tips, blank science journal, and poster board layout. It helps fourth and fifth graders create age-appropriate experiments with less parental guidance. Teachers can use as a classroom unit on the scientific method, science processes, and to help complete a whole-class project. We will help make the science fair a fun and rewarding experience.Don't be nervous when your child says they want to participate in the science fair.Nervous about pl
Subjects:
Grades:
4th - 6th, Staff
NGSS:
3-5-ETS1-3
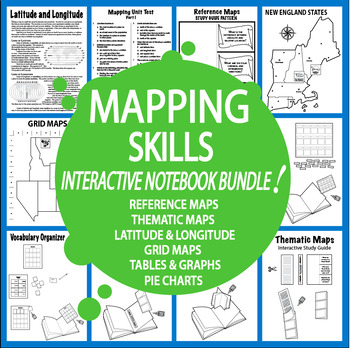
Geography Map Skills Activities – 6 Mapping Units – Geography Test Prep
Teach students to use Reference Maps, Thematic Maps, Latitude and Longitude, Grid Maps, Coordinate Pairs, Bar Graphs, Line Graphs, and Pie Charts. We've provided all of the nonfiction informational CONTENT, engaging hands-on Mapping and Graphing activities, SEVENTEEN Interactive Notebook assignments (all patterns and step-by-step directions included!), and a comprehensive Mapping Skills Test.
Our Map Skills Bundle features Mapping, Graphing, and Geography activities that expose students to
Subjects:
Grades:
4th - 7th
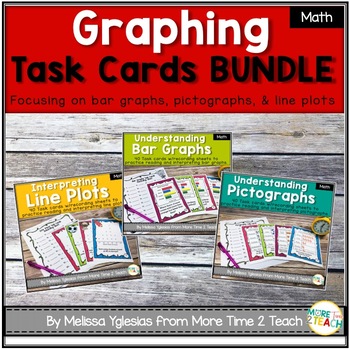
Graphing Task Cards Bundle
Task cards are a wonderful way of engaging students! I frequently use them in my classroom and my students love them. Personally I enjoy their versatility! I like being able to use them one day as a math center and another day as a warm up activity. Once you've printed the task cards and laminated them for durability the possibilities are endless!With this download you will receive 3 sets of graphing task cards for the price of 2... that's a savings of more than 30%! The sets included in this bu
Subjects:
Grades:
2nd - 5th
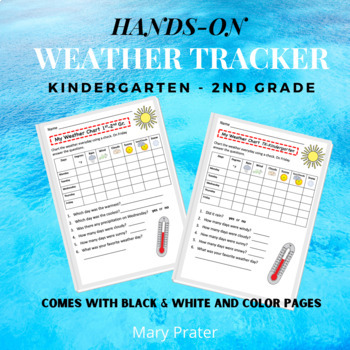
Weather Chart Printable K-2nd
Kindergarten - 2nd Grade Weather Tracker Printable is a visual aid for K-2 to chart daily weather conditions. This can be used as a guided activity for TK-Kindergarten or an independent weather tracker for 1st-2nd grades. The rows list the days of the week and along the top of each column is a box for temperature, precipitation, wind, and sunshine.On the last day (Friday) there are questions to answer about the week's weather.There are two charts. One is for TK and Kindergarten which have yes an
Subjects:
Grades:
PreK - 2nd
Also included in: BUNDLE - Grade Weather Chart for Kids Printable & Google Slides
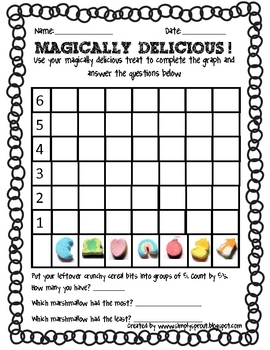
Magically Delicious Lucky Charms graphing
Get into the spirit of St. Patrick's Day with this "Magically Delicious" graphing activity. Students use a small handful of Lucky Charms cereal to complete a graph and to answer questions. Perfect for the primary classroom.
Subjects:
Grades:
PreK - 3rd
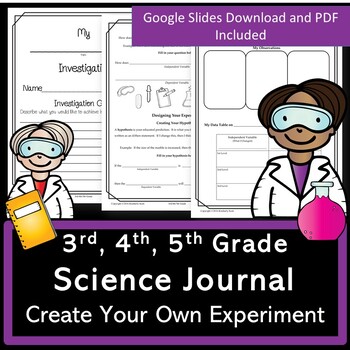
Science Experiment Journal Template | Digital Or Print | Grades 3 4 5
Are you looking to create hands-on investigations with your upper elementary students? Help students think like a scientist using a lab report template. Included are a student-editable Google Slide document and a PDF version. We will take you step by step in designing unique experiments on the topic of your choice. A Google Slide version is included. We feel this journal is great to assign students to perform an experiment at home. During this time of digital learning, students can use suppli
Subjects:
Grades:
3rd - 6th
NGSS:
3-5-ETS1-3
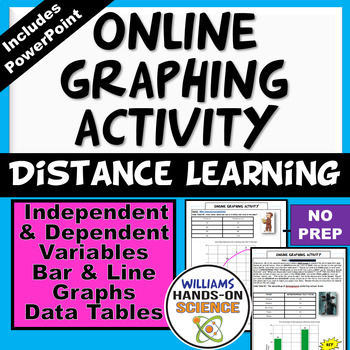
Distance Learning NGSS Online Graphing Activities Google Print Or Digital
This product is a great way to introduce graphing! This product includes four data tables the students use to create graphs using a website and it includes very detailed directions, questions and a key. The website I provide also has tutorials on how to graph, how to choose between a line graph and a bar graph, the difference between Independent and Dependent Variables and lots more! The other great aspect of this computer lab is following directions. Kids tend to say, “I can’t figure it out?”,
Subjects:
Grades:
6th - 11th
Types:
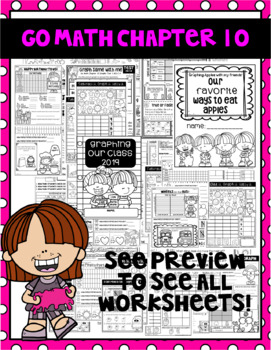
First Grade Go Math Chapter 10 Graphing - Represent Data
My favorite chapter yet! You can do so much with graphing! This unit will cover Go Math's Lesson 10.1 - 10 Worksheets10.2 - 7 Worksheets10.3 - 9 Worksheets10.4 - 6 Worksheets10.5 - 9 Worksheets10.6 - 9 Worksheets10.7 - 3 Worksheets******Please see the preview as some of these are "duplicate worksheets". I have leveled several of the worksheets in hopes of providing for all of your students. They are leveled as follows:1 - struggling2 - just right3 - challengingI have also included my Graphin
Subjects:
Grades:
1st
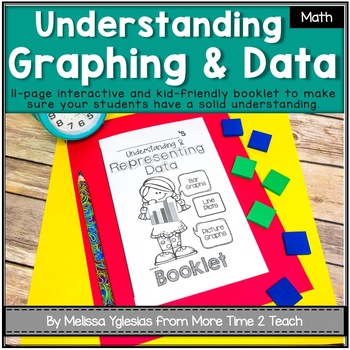
All About Data Theme Booklet {Mastering Pictographs, Bar Graphs, & Line Plots}
Do you always feel that you're short on MATH TIME in the classroom?Do you feel that your MATH TEXTBOOK is lacking in meeting your students needs?Are you looking for a QUICK and EASY TO USE math resource to make sure that your students are engaged in their math lesson and fully understand the standard?This ALL ABOUT DATA THEME BOOKLET which is geared towards 3rd grade, but can be used in 2nd and 4th grades as well, focuses on Standard 3.MD.3-4 {Represent and interpret data in pictographs, bar gra
Subjects:
Grades:
2nd - 4th
4th Grade Science Curriculum NGSS Curriculum for Entire Year
An entire year of 4th grade elementary NGSS science. These seven units cover all of the 4th grade content standards of the Next Generation Science Standards. Each unit is full of inquiry based activities, data tables and graphs, reading comprehension, worksheets, lots of other resources and comes with an engaging PowerPoint. STEM activities are embedded in some of the units. Works for homeschool science or a classroom teacher. Please click the previews on each unit to see the description for e
Subjects:
Grades:
4th
Types:
NGSS:
4-PS4-2
, 4-LS1-1
, 4-PS3-4
, 4-ESS1-1
, 4-PS3-3
...
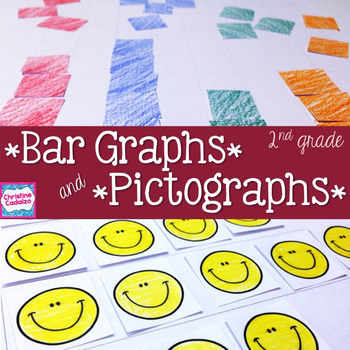
Pictograph and Bar Graph Math Unit- Second Grade
Complete math unit for teaching Common Core standard 2.MD.10- making and reading pictographs and bar graphs. This unit covers the following pictograph & bar graph concepts:Reading Bar Graphs: -what a bar graph is and why we use them-reading the title and labels of a bar graph-understanding a bar graph scale-finding how many in each category-strategies for answering addition and subtraction questions based on the bar graph dataMaking Bar Graphs:-making a four category bar graph-making a singl
Subjects:
Grades:
1st - 3rd
CCSS:
Showing 1-24 of 698 results


