🎉 Teacher Appreciation: Save up to 25% using promo code THANKYOU24. Sale ends in 5 hrs 23 min. Learn more
4,869 results
Graphing lessons
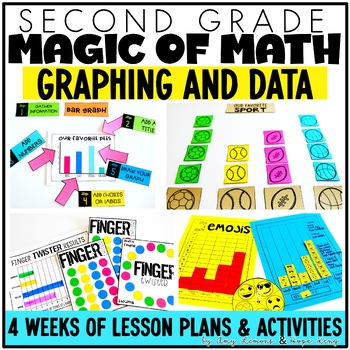
2nd Grade Magic of Math for Data & Graphs | Bar Graphs, Pictographs, Line Plots
Graphing in 2nd grade made easy with hands-on bar graph, pictograph, and line plot activities! A complete curriculum for teaching students to interpret data and graphs, plus templates and a graphing project!The Magic Of Math Unit 8 for SECOND GRADE focuses on: Week 1: Bar Graphs Week 2: Pictographs Week 3: Line Plots Week 4: Word Problems Here is what is included in this two-week-long unit for 2nd grade: -Daily Lesson Plans for 20 days-Aligned with the 2nd Grade Common Core and TEKS-20
Grades:
2nd
Types:
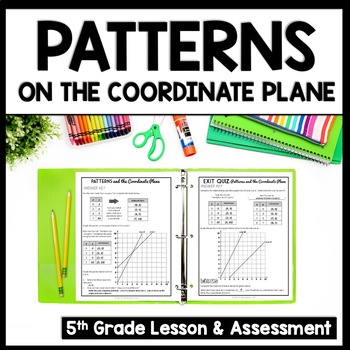
Patterns & Coordinate Grid/Plane Notes, Graphing Ordered Pairs, Plotting Points
Are your students struggling with plotting points on a coordinate grid? Try these Patterns on the Coordinate Plane Notes! After 8 pages of coordinate graphing & using ordered pairs to create lines in quadrant 1, your students will be experts! This lesson packet is perfect for small-group math intervention or whole-group review. Best of all, these Patterns on the Coordinate Plane notes require NO PREP! Just print and teach!This “Plotting Ordered Pairs to Create Patterns” packet includes: ✅
Subjects:
Grades:
5th - 6th
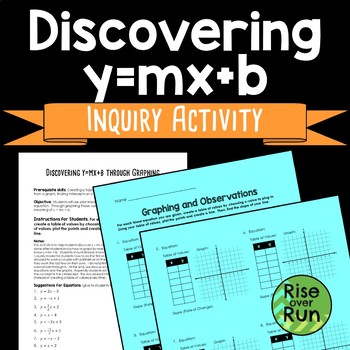
Discovering y=mx+b through Graphing, Slope Intercept Form
This activity will help students discover the slope and y-intercept of slope-intercept form. Students will use prior knowledge of creating a table of values from an equation. Through graphing those values, student will observe and discover the meaning of y = mx + b, slope-intercept form. This activity is to help students discover y = mx + b without being told its meaning. It should be done after students know how to graph by making a table of values, but before students know y = mx + b. Stude
Grades:
7th - 8th
Types:
CCSS:
Also included in: 8th Grade Math Discovery Lessons and Activities Bundle
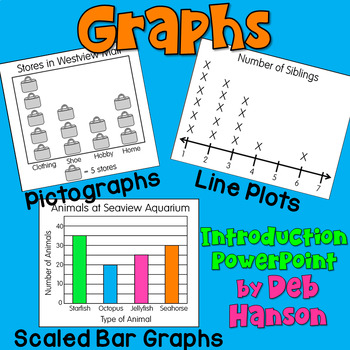
Graphs PowerPoint and Notes: Pictographs, Scaled Bar Graphs, Line Plots
Are you searching for a step-by-step PowerPoint that can be used to introduce graphing concepts to your students in a way that will grab their attention? You've come to the right place! Teach third and fourth-grade students about graphing concepts with this 70-slide PowerPoint lesson. Students will have many opportunities to draw and interpret the various types of graphs. It includes frequency tables, picture graphs, pictographs, scaled picture graphs, scaled bar graphs, and line plots. Use his
Subjects:
Grades:
3rd - 4th
Also included in: Graphs Bundle: Scaled Bar Graphs, Pictographs, and Line Plots
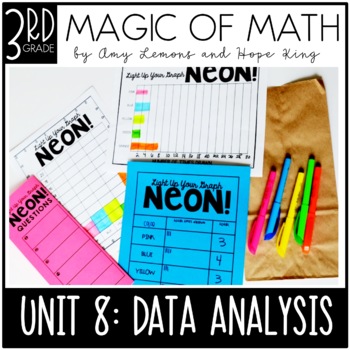
3rd Grade Magic of Math Bar Graphs, Pictographs, Line Plots, Frequency Tables
It's time to up the engagement when teaching data analysis and graphing in 3rd grade! Try this complete set of plans and hands-on activities for analyzing data and collecting, graphing (bar, pictograph, line plot, and frequency tables), and a fun graphing project!The Magic Of Math Unit 8 for THIRD GRADE focuses on: Week 1: Bar Graphs (scales of 1 or more) Week 2: Pictographs (scales vary) Week 3: Line Plots with Measuring to the Nearest Quarter and Half Inch Week 4: Frequency Tables and Gr
Grades:
3rd
Types:
Guided Math 2nd Grade 2-Digit and 3-Digit Addition and Subtraction Unit 4
Guided Math Whole Group and Teacher-Led Small Group Lessons 2nd Grade Download the Free Standards-Alignment for Guided Math2-Digit and 3-Digit Addition and Subtraction 2-Digit addition without regrouping (using strategies) 2-Digit subtraction without regrouping (using strategies) 2-Digit addition with regrouping2-Digit subtraction with regroupingAdding three 2-Digit numbersAdding four 2-Digit numbers3-Digit addition without regrouping3-Digit subtraction without regrouping3-Digit addition with re
Subjects:
Grades:
2nd
Types:
Also included in: Second Grade Guided Math Bundle
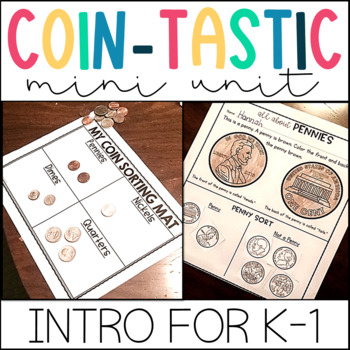
Money Worksheets and Activities | Identifying and Counting Coins Money Unit
A money unit on introducing children to identifying and counting coins! This resource contains lessons, activities, centers, games, posters, and everything you need for a successful unit. Skills: Coin recognition and counting by pennies!Coins: Penny, Nickel, Dime, and QuarterClick here to get a free sample of this resource!What is included in this product?-Detailed Unit Plan, flexible for 1-2 week duration-All About Coins Printables (1 sheet for each coin)-Coin Cut Outs and Anchor Chart Headers
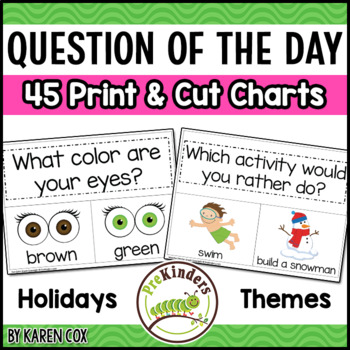
Question of the Day Graph Kit for Preschool, Pre-K, K
Print and cut these 45 graphs for simple and quick large group activities!Includes holidays and themes. Whole group Math and Literacy.You can laminate and reuse these each year in a pocket chart, or print and glue to chart paper.-----------------------------------------------------------------------------------------------------------------Want more Graph Kits? Click here to see all Graph Sets!-------------------------------------------------------------------------------------------------------
Subjects:
Grades:
PreK - K
Types:
CCSS:
Also included in: Question of the Day Graphs Preschool Pre-K Kindergarten BUNDLE
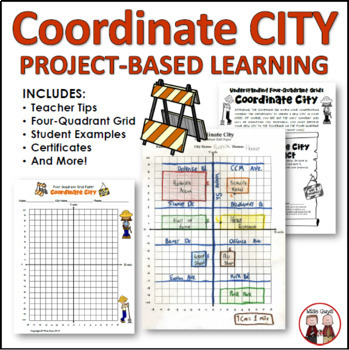
End of Year Math Coordinates City Project
Are you looking for an engaging end of year activity to teach coordinates to your upper elementary and middle school math students? Your upper elementary and middle school students will become engaged as they are asked to design a city based on using a coordinate plane. This is a teacher-friendly resource and minimal prep is involved.This resource contains 9 total documents (12 pages total) that are intended to be a creative math lesson plan that has students create their own city using coordina
Subjects:
Grades:
4th - 6th
Types:
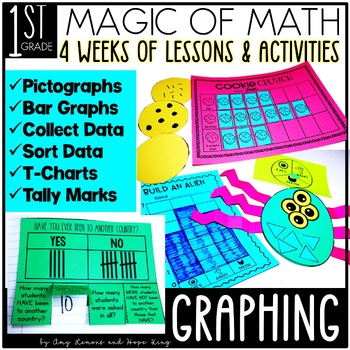
1st Grade Magic of Math Lesson Plans for Graphing | Data Analysis | Graphs
Students will be working individually and as a class to graph and collect data! With lesson plans for pictographs, bar graphs, and tally graphs, students will use hands-on activities to practice and review graphing before acing their assessments! The Magic Of Math Unit 8 for FIRST GRADE focuses on: Week One: Pictographs Week Two: Bar Graphs Week Three: Tally Charts with Collecting Data Week Four: Graphing Wrap-Up Want to know what activities are included? Check out below! Week One:
Grades:
1st
Types:
CCSS:
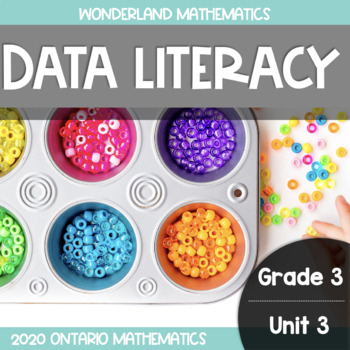
Grade 3, Unit 3: Data Literacy (Ontario Math)
Grade 3, Unit 3: Data Literacy is a 150+ paged resource designed to meet the Ontario 2020 Mathematics curriculum expectations for the Data strand. This resource includes lessons, activities, and assessments that introduce students to bar graphs, pictographs, frequency tables, and sorting using three attributes. Please note this is a printable resource. There is NO Google Slide component to this resource.Wonderland Math is a math unit series designed to meet the Ontario 2020 Mathematics curriculu
Subjects:
Grades:
3rd
Types:
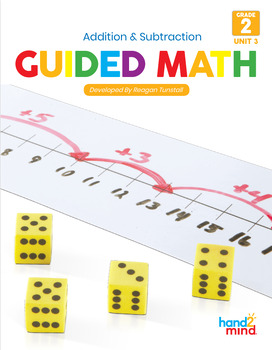
Guided Math 2nd Grade Addition and Subtraction Strategies Unit 3
Guided Math Whole Group and Teacher-Led Small Group Lessons 2nd Grade Download the Free Standards-Alignment for Guided MathAddition and Subtraction StrategiesThis unit provides key strategies for second graders to gain flexible and accurate computation. Addition to 20 strategies to build automaticitySubtraction to 20 strategies to build automaticityDoubles and near doublesAdding three numbersMaking 10 to addWord problemsRelated FactsPart part wholeResult unknownChange unknownBalancing across th
Subjects:
Grades:
2nd
Types:
Also included in: Second Grade Guided Math Bundle
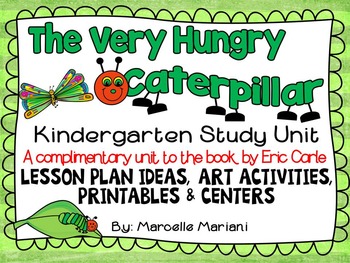
The Very Hungry Caterpillar Kindergarten Lesson Plans and Activities
This “The Very Hungry Caterpillar” lesson plans and activities resource is a complementary study unit for the popular book by Eric Carle. This unit offers lesson suggestions and ideas for pre-reading and post reading of the book as well as centers and worksheets relating to the book. PLEASE BE ADVISED THAT THIS UNIT IS A CROSS OVER WITH A LARGER INSECTS UNIT I TEACH (see link) INSECTS MEGA PACK (No prep printables, lesson plans and centers and SOME OF THE TOOLS HERE, SUCH AS THE ART ACTIVITIES
Subjects:
Grades:
PreK - 1st
Types:
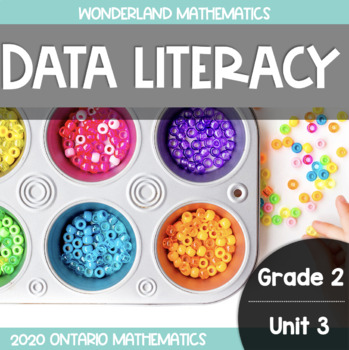
Grade 2, Unit 3: Data Literacy (Ontario Mathematics)
The Grade 2, Unit 3: Data Literacy resource is a 100+-paged resource designed to meet the 2020 Ontario Mathematics curriculum expectations for Strand D: Data. This unit introduces students to concrete graphs, pictographs, and tally charts. Students learn how to read and interpret graphs and draw conclusions based on pre-made graphs. Students also create simple surveys involving 2 - 4 options, conduct the survey, and collect and interpret data. Please note this is a printable resource. There is N
Subjects:
Grades:
2nd
Types:
Also included in: Grade 2 Wonderland Mathematics: The Bundle (Ontario 2020 Math)

Kinetic Energy Graphing and Analyzing Relationships of Mass and Speed MS PS3-1
Do you need to teach about kinetic energy? This resource is on kinetic energy and its relationship to mass and speed. Students will analyze graphs and construct graphs to show that mass and speed increase kinetic energy. This resource starts with a slide show on kinetic energy and phenomena. Students will love learning about kinetic energy.This resource includes:a slide showstrategic notetaking guideresponse pagesquizanswer keysTeachers Love This Resource!Edith ⭐️ ⭐️ ⭐️ ⭐️ ⭐️ Extremely Satisfied
Subjects:
Grades:
6th - 8th
Types:
NGSS:
MS-PS3-1
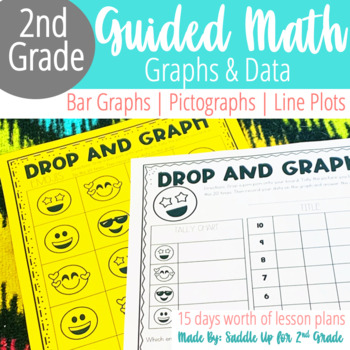
2nd Grade Graphing & Types of Graphs: Bar Graphs, Pictographs, & Line Plots
Do you need engaging 2nd grade guided math lessons and resources? This pack of 2nd grade graphing lesson plans is filled with hands-on engagement and interactive notebook activities! These PRINT & GO lesson plans will help you teach various types of graphs such as bar graphs, pictographs, and line plots. This 2nd grade guided math unit comes with 3 weeks worth of done-for-you lesson plans to teach types of graphs and data. These 2nd grade graphing activities were created to introduce, practi
Grades:
2nd
Types:
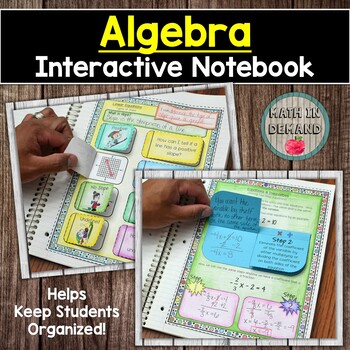
Algebra Interactive Notebook with Guided Notes and Examples
There are a total of 10 units that include:Unit 1 - Prerequisite for Algebra and Algebraic ExpressionsUnit 2 - Solving and Graphing Linear Equations and InequalitiesUnit 3 - Features of a FunctionUnit 4 - Sequences (Arithmetic and Geometric)Unit 5 - Graphing Lines and Determining SlopeUnit 6 - Expressions Containing ExponentsUnit 7 - Solving and Graphing Systems of Equations and InequalitiesUnit 8 - Identifying, Classifying, and Operations on PolynomialsUnit 9 - Features of QuadraticsUnit 10 - D
Grades:
8th - 12th
Also included in: Custom Bundle for E.S.
Geometry Notes for Interactive Notebooks YEAR-LONG BUNDLE
Geometry teachers, do you need quality guided notes for your interactive notebooks (INB) that don't waste paper? Save yourself the time you would spend creating them yourself! These no-waste guided notes with examples provide two student notebook pages with each printed page.View the preview to see what all is included and what each page of notes looks like.Why buy the bundle?You pay $40 for what is worth $68.75! BIG SAVINGS! Additionally, you get three bonus files!What is included?1-1 Points, L
Grades:
8th - 10th
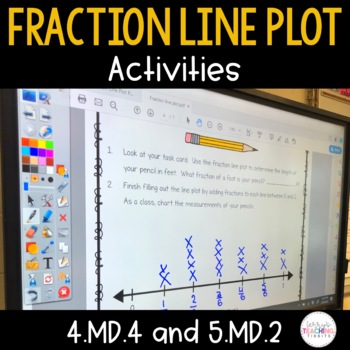
Fraction Line Plot Activities - 4.MD.4 and 5.MD.2
Plotting fractions on a number line has never looked so fun! This pack comes with 3 whole group or small group activities for fraction line plots. Students are given individual task cards of an object measured on a fraction number line. As a class, each student will determine the fraction of their object and plot it onto a class line plot. Students will then use their class-created data and answer to answer questions.What You Get:3 sets of task cards (pencils, nails, and erasers)28 task card
Subjects:
Grades:
4th - 6th
Types:
8th Grade Math Bundle ~ All My 8th Grade Math Products at 1 Low Price
This bundle includes all the notes, worksheets, & activities in my store that pertain to 8th Grade Mathematics.Does this Include Digital Resources?As of May 2024 over 80% of this bundle includes a digital Google Slides or Forms option.Please view the preview to view the content list & which resources include a digital option. All digital resources are in bold and have a check mark next to them.I'm working as fast as possible to convert existing resources to digital. As resources are co
Subjects:
Grades:
8th
Types:
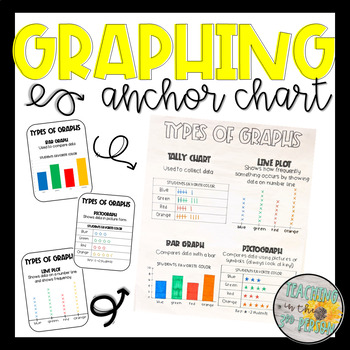
Types of Graphs Anchor Chart - Tally Chart, Bar Graph, Pictograph, Line Plot
Graphing made easy!Use these templates as a guide in creating your own anchor charts or print and use them in other helpful ways:Trace and create an anchor chart with studentsPrint on bright colored paper and use as postersShrink down and glue in student' math notebooks for a reference sheetPrint and send home as reference tools for students and parents (homework or tutoring)Earn Credit for Future Purchases:I appreciate each & every word of your valuable feedback. Also, if you leave feedback
Grade 1, Unit 4: Data Literacy (Ontario Mathematics)
The Grade 1, Unit 4: Data Literacy resource is a 100+-paged resource designed to meet the 2020 Ontario Mathematics curriculum expectations for Strand D: Data. This unit introduces students to concrete graphs, pictographs, and tally charts. Students learn how to read and interpret graphs and draw conclusions based on pre-made graphs. Students also create simple surveys involving 2 - 4 options, conduct the survey, and collect and interpret data. Please note this is a printable resource. There is N
Subjects:
Grades:
Homeschool
Types:
Also included in: Grade 1 Wonderland Mathematics: The Bundle (Ontario Mathematics)
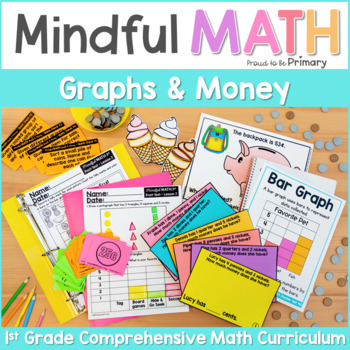
Grade 1 Math - Graphing, Money & Financial Literacy - First Grade Math Centers
This Mindful Math First Grade Money and Graphing unit is a comprehensive math curriculum that was designed to be teacher and student-friendly and includes 9 lessons to teach money (coins, counting coins, and financial literacy) and graphing (collect, organize, display and describe data on pictographs and bar graphs).It was created to give teachers a ready-to-teach math curriculum that is fun, engages minds, and leaves students knowledgeable and fluent in math concepts.Go from boring, complicated
Subjects:
Grades:
1st
Types:
CCSS:
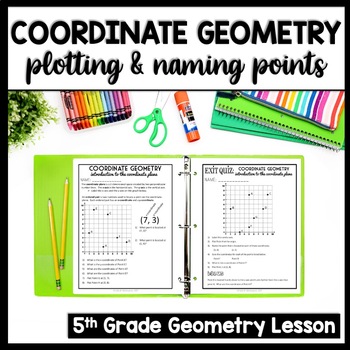
Graphing Ordered Pairs on a Coordinate Grid, Quadrant 1 Coordinate Plane Notes
Are your students struggling with graphing ordered pairs on a coordinate grid? Then these Quadrant 1 Coordinate Plane Notes for you! 8-pages of common core aligned coordinate grid practice are perfect for math intervention or to supplement your core curriculum!Best of all, these coordinate plane notes require NO PREP! Just print and teach!This “Graphing Ordered Pairs on a Coordinate Grid” packet includes: ✅ Scripted Instructional Guide✅ Teacher Lead Problem-Set✅ Partner Practice✅ 3-page Indepe
Subjects:
Grades:
5th
CCSS:
Showing 1-24 of 4,869 results


