🎉 Teacher Appreciation: Save up to 25% using promo code THANKYOU24. Sale ends in 2 hrs 21 min. Learn more
1,790 results
Graphing graphic organizers
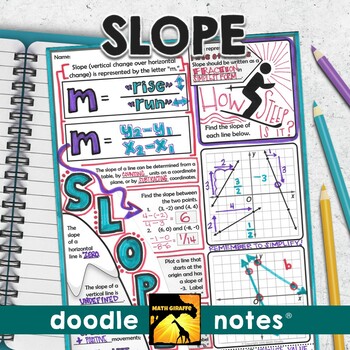
Slope Doodle Notes | Visual Interactive Math Doodle Notes for Algebra
Slope "doodle notes" - visual note taking pages with interactive tasks for building stronger retention of slope of a line lesson concepts in AlgebraBoost your students' focus and memory! The blend of graphic and linguistic input in these guided visual notes helps students' brains to convert the information to long-term memory more easily. When students color or doodle in math class, it activates both hemispheres of the brain at the same time. There are proven benefits of this cross-lateral brai
Grades:
7th - 9th
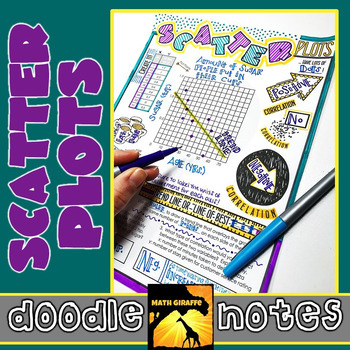
Scatter Plots Doodle Notes
Creating & Analyzing Scatter Plots - Visual Interactive "Doodle Notes"
When students color or doodle in math class, it activates both hemispheres of the brain at the same time. There are proven benefits of this cross-lateral brain activity:
- new learning
- relaxation (less math anxiety)
- visual connections
- better memory & retention of the content!
Students fill in the sheets, answer the questions, and color, doodle or embellish. Then, they can use it as a study guide later on.
C
Subjects:
Grades:
7th - 8th
CCSS:
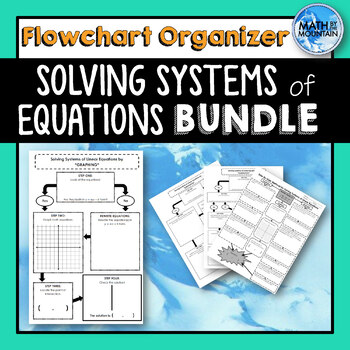
Systems of Equations *Flowchart* Graphic Organizers BUNDLE
Help your students visualize the solving process for the three methods of solving systems of linear equations: graphing, substitution, and elimination. This is the perfect differentiation and scaffolding tool to ensure all of your students can solve systems of equations!Included Resources:Solving by Graphing Flowchart Graphic OrganizerIncludes full-sheet, half-sheet, and mini-book sizes Two versions for coordinate grid sizes: -5 to 5 and -10 to 10Solving by Substitution Flowchart Graphic Organi
Grades:
7th - 12th
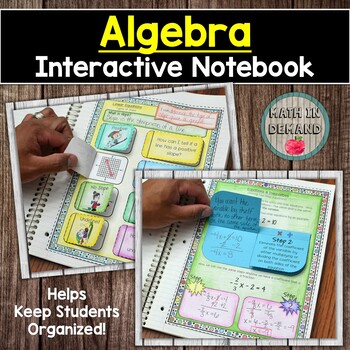
Algebra Interactive Notebook with Guided Notes and Examples
There are a total of 10 units that include:Unit 1 - Prerequisite for Algebra and Algebraic ExpressionsUnit 2 - Solving and Graphing Linear Equations and InequalitiesUnit 3 - Features of a FunctionUnit 4 - Sequences (Arithmetic and Geometric)Unit 5 - Graphing Lines and Determining SlopeUnit 6 - Expressions Containing ExponentsUnit 7 - Solving and Graphing Systems of Equations and InequalitiesUnit 8 - Identifying, Classifying, and Operations on PolynomialsUnit 9 - Features of QuadraticsUnit 10 - D
Grades:
8th - 12th
Also included in: Custom Bundle for E.S.
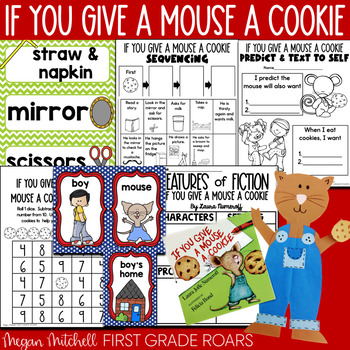
If You Give a Mouse a Cookie Activities Book Companion Reading Comprehension
This packet is the perfect companion to Laura Numeroff's story, If you Give a Mouse a Cookie. This book companion is filled with comprehension reading strategies, math games, word work and writing ideas. A fun mouse and cookie craft is also included. Included you will find...Lesson TipsExamples of Cause and EffectPosters for Cause and EffectPosters for Sees, Does, Thinks, FeelsPosters for Characters and Setting PredictingCircle Story-sequencing cut and pasteCause and EffectStory MappingText Conn
Subjects:
Grades:
K - 2nd
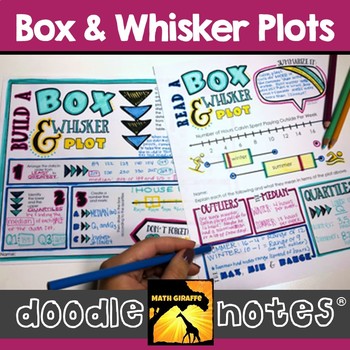
Box and Whisker Plots Doodle Notes
reading and creating box & whisker plots: visual interactive "doodle note" setWhen students color or doodle in math class, it activates both hemispheres of the brain at the same time. There are proven benefits of this cross-lateral brain activity:- new learning- relaxation (less math anxiety)- visual connections- better memory & retention of the content!Students fill in the sheets, answer the questions, and color, doodle or embellish. Then, they can use it as a study guide later on. G
Subjects:
Grades:
6th - 8th
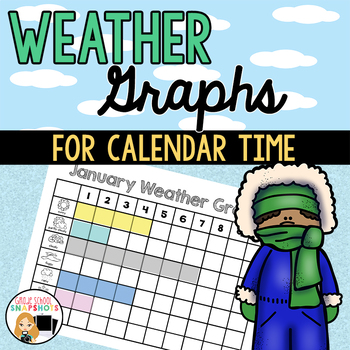
Weather Graphs for Calendar Time
This is a set of monthly weather graphs to be used at calendar time. A student will be the weather reporter and fill in the graph with that day's weather. Includes 12 months of graphs. One set of 12 has sunny, partly cloudy, cloudy, foggy, rainy, snowy, and stormy. The second set of 12 includes all of the previous and also includes windy. They are provided with 10 or 20 columns. Choose the set that works for you.Also included are pocket chart cards for introducing the weather. You can als
Subjects:
Grades:
PreK - 2nd
Also included in: Back to School Bundle of Essentials
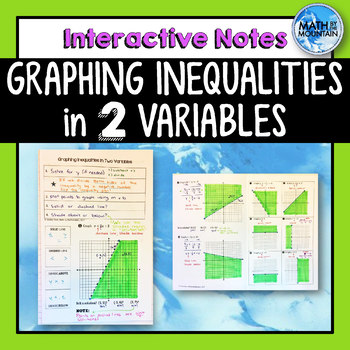
Graphing Linear Inequalities in 2 Variables Interactive Notebook Notes
These notes are perfect for an interactive notebook (INB) and are built to reinforce prior concepts. Help your students see the process graphing inequalities in two variables on the coordinate plane. Explore the special cases of vertical and horizontal inequalities! In some examples, students must solve for y prior to graphing, which is a fantastic review of (1) rerwriting equations, (2) remembering the flip the sign, and (3) identifying slope and y-intercept! The front page of these notes are
Subjects:
Grades:
6th - 10th
CCSS:
Also included in: Unit 7 - Systems of Equations & Inequalities - Interactive Notebook Kit
"Chrysanthemum" Back to School Activities
This unit extends the story and uses 11 various activities to get the kids brainstorming kind acts and thinking about what makes each child special.
Chrysanthemum by Kevin Henkes is a wonderful back to school story that encourages kids to accept others & celebrate what makes us unique!
Activities include:
1. Kind words to describe Chrysanthemum
2. Story Map
3. My name means...
4. I love the way my name looks in...(kids practice writing their name in ink, crayon, pencil, and glitter (
Subjects:
Grades:
PreK - 1st
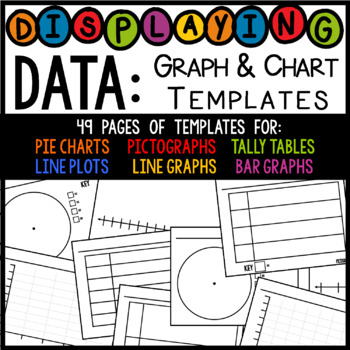
Displaying Data: Graph, Table, and Chart Templates (PDF & PNG)
These forms can be used for almost anything having to do with displaying data in a visual form. I've included the most popular graphs and tables used in elementary school. All templates below come in a PDF and a PNG. You can use the PNG to edit the graphs and charts in PowerPoint by using text boxes. Pie ChartsThere are 7 options for pie charts (2 to 9 categories). Line PlotsThere are 4 options for line plots: 5 lines, 7 lines, 13 lines, 18 lines. PictographsThere are 5 options for pictograph
Grades:
1st - 8th
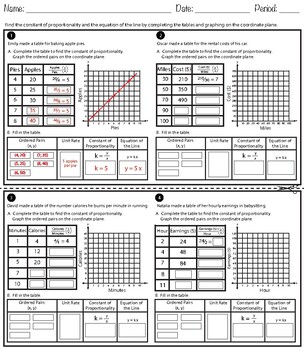
Identifying Constant of Proportionality Using Tables, Graphs and Equations
These worksheets can be served as a graphic organizer or a handout to practice in identifying constant of proportionality (unit rate) using tables, graphs, equations and verbal descriptions of proportional relationships. Students will make tables of equivalent ratios, find missing values in the tables, and plot the pairs of values on the coordinate plane to identify the constant of proportionality. Students will also select statements which is true or false in interpreting a point (x, y) on t
Grades:
6th - 8th
Polynomial Functions Unit | Algebra 2 | Add, Subtract, Multiply, Divide, Factor
Put your mind at ease when teaching Polynomial Functions in Algebra 2 with this creative, comprehensive, and clear curriculum! This unit covers – classifying polynomials; operations: adding, subtracting, multiplying, and dividing; graphing; factoring; solving; and theorems. These easy to understand guided notes, video warm-ups, assessments, and applications help students better understand polynomial functions at a high level.What is included in this resource bundle?Learning Target - Clip ChartsA
Subjects:
Grades:
10th - 12th
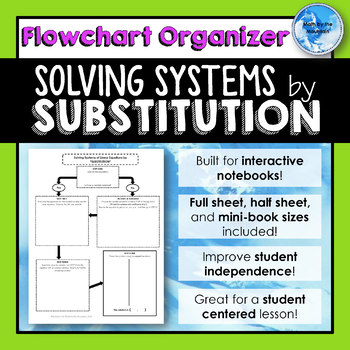
Solving Systems of Equations by SUBSTITUTION *Flowchart* Graphic Organizers
Help your students visualize the solving process for the substitution method of solving systems of linear equations. Students are able to easily lead themselves or others through a problem, even if it is their first time using this method. Includes*Solving by Substitution Flowchart Graphic Organizer (half-sheet size)*Solving by Substitution Flowchart Graphic Organizer (full-sheet size)*Solving by Substitution Flowchart Graphic Organizer (mini-book size)Half sheets and mini-books are great for in
Grades:
7th - 12th
CCSS:
Also included in: Systems of Equations *Flowchart* Graphic Organizers BUNDLE
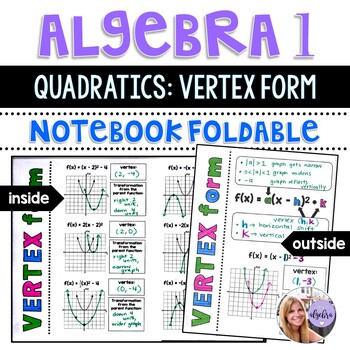
Algebra 1 - Transformations of Quadratic Functions - Vertex Form - Foldable
This is a foldable designed for interactive math notebooks. There are also 2 bonus pages of practice problems for the students to do, as well!Here is the link of me teaching this lesson using this resource on YouTube! Feel free to use this as additional support for your students. https://www.youtube.com/watch?v=lKABemkVP7c&list=PLDKrf9k92mfhAvVHMJ4Xu_Hcw-9fRV6jQ&index=6&t=3sThis foldable walks students through the process of the following transformations:Each graph starts with the p
Subjects:
Grades:
8th - 11th
Also included in: Algebra 1 - Second Half of the School Year Foldable GROWING BUNDLE
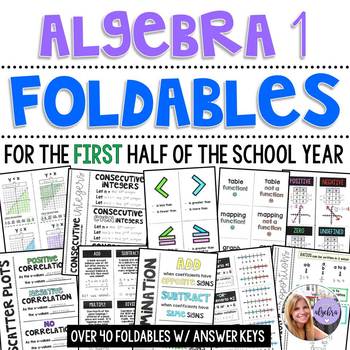
Algebra 1 - First Half of the School Year FOLDABLE BUNDLE
This is a list of the currently uploaded foldables in this bundle. It is an ever-growing bundle that will continue to be updated, so for one price you can always have every resource! This has a current value of over $63 if bought separately! Check out my store for individual views of foldables. A second-half of the year set is also in my TPT store, as well as corresponding task cards and games!Variables and ExpressionsOrder of OperationsThe Number Properties (Chart added as the bonus file No
Subjects:
Grades:
7th - 10th

Solving Systems of Equations by ELIMINATION *Flowchart* Graphic Organizers
Help your students visualize the solving process for the elimination method of solving systems of linear equations. Students are able to easily lead themselves or others through a problem, even if it is their first time using this method. Includes*Solving by Elimination Flowchart Graphic Organizer (half-sheet size)*Solving by Elimination Flowchart Graphic Organizer (full-sheet size)*Solving by Elimination Flowchart Graphic Organizer (mini-book size)Half sheets and mini-books are great for intera
Grades:
7th - 12th
CCSS:
Also included in: Systems of Equations *Flowchart* Graphic Organizers BUNDLE
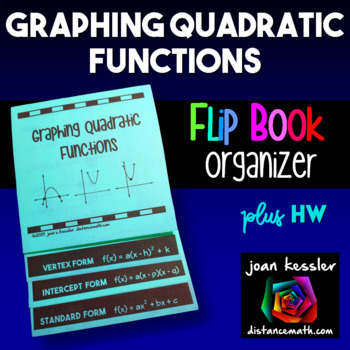
Graphing Quadratic Functions Parabolas Flip Book Foldable plus HW
This Quadratics / Parabolas Flip Book foldable provides a summary of the graphs of Quadratic Functions when the equations are given in Standard Form, Intercept Form, and Vertex Form. Within the foldable are definitions, formulas, examples, and problems for students to complete along with 6 Parabolas for them to graph using each of the 3 forms. There is room for extra notes as well as labeling the characteristics of each graph.Also included is :the solution key in its own flip bookAdditional work
Subjects:
Grades:
8th - 10th
CCSS:
Also included in: Algebra 2 Activity Bundle
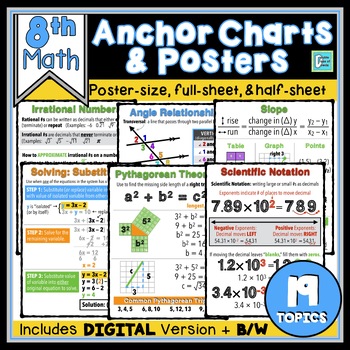
8th Grade Math Anchor Charts | Interactive Notebooks, Posters, Print & Digital
Looking for MATH ANCHOR CHARTS to help your students visualize the major topics in your 8th grade math classroom? Hang these on the wall as POSTERS and give students copies for their INTERACTIVE NOTEBOOKS. We keep anchor charts simple and neat so as not to overwhelm students and help keep them focused on essential information.These are one-page anchor charts for 19 TOPICS that comes in THREE FORMATS including a single page, half sheets (great for interactive notebooks!), and a 2x2 POSTER. The po
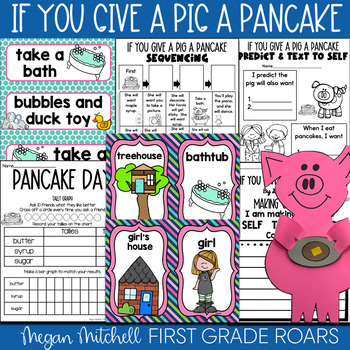
If You Give a Pig a Pancake Activities Book Companion Reading Comprehension
his packet is the perfect companion to Laura Numeroff's story, If you Give a Pig a Pancake. This book companion is filled with comprehension reading strategies, math games, word work and writing ideas. A fun pig and pancake craft is also included. Included you will find...Lesson TipsExamples of Cause and EffectPosters for Cause and EffectPosters for Sees, Does, Thinks, FeelsPosters for Characters and Setting PredictingCircle Story-sequencing cut and pasteCause and EffectStory MappingText Connect
Subjects:
Grades:
K - 2nd
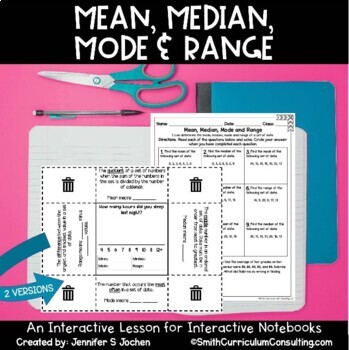
Mean, Median, Mode and Range Foldable Interactive Notebook Lesson with Practice
Ready to review the basics of Mean, Median, Mode and Range? This flippable has all that you need for your students to have a resource for the definition, a keyword to help them remember, as well as a graph to compile data from the class and determine the Mean, Median, Mode, and Range for your class data!Includes:Teacher Directions with a full-color photoMean, Median, Mode, and Range Foldable (2 versions)Mean, Median, Mode, and Range Practice SheetMean, Median, Mode, and Range Practice Sheet Answ
Subjects:
Grades:
5th - 7th
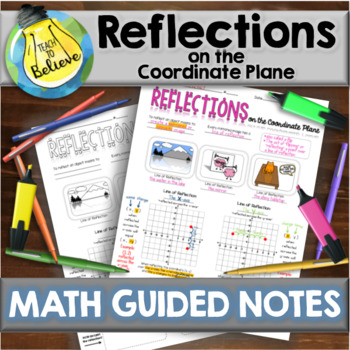
Reflections on the Coordinate Plane - Guided Notes
Reflections on the Coordinate Plane - Guided Notes These notes explain to your students how to reflect a point across an axis. What is Covered:-Explanation of "Line of Reflection"-Explanation of Reflecting Across an Axis-ExamplesWhat's Included:-Blank Student Copy-Typed Colorful Key-Completed Student SampleHow to Use This Product:After students have completed these guided notes, it is best for them to keep them in sheet protectors in a math folder. You can download a FREE blank table of contents
Grades:
6th
CCSS:
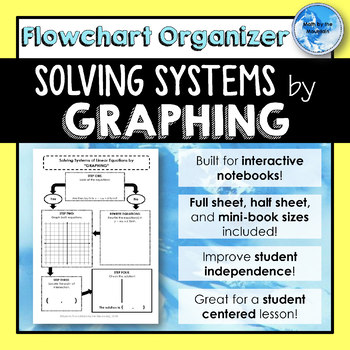
Solving Systems of Linear Equations by GRAPHING *Flowchart* Graphic Organizers
Help your students visualize the solving process for the graphing method of solving systems of linear equations. Students are able to easily lead themselves or others through a problem, even if it is their first time using this method. Includes*Solving by Graphing Flowchart Graphic Organizer (half-sheet size)*Solving by Graphing Flowchart Graphic Organizer (full-sheet size)*Solving by Graphing Flowchart Graphic Organizer (mini-book size)Half sheets and mini-books are great for interactive note
Grades:
7th - 12th
CCSS:
Also included in: Systems of Equations *Flowchart* Graphic Organizers BUNDLE
Spookley the Square Pumpkin Bundle
Get four of my Spookley Book Companion Sets!! PLUS....a new addition!!! Spookley sequencing and retelling necklace craft set! *UPDATED August 2021 to include my Spookley SEL packet! Set one is My Original Book Companion!!Includes: EMERGENT READER with a focus on shapes CIRCLE, SQUARE, OVAL, HEART, RECTANGLE, STAR, TRIANGLE AND DIAMONDPOCKET CHART CARDS for sequencing and retelling (ideas for story participation) POSITIONAL Word Work Poster Cards for language Where is Spookley? BESIDE, BEHIND, ON
Subjects:
Grades:
PreK - 1st, Staff
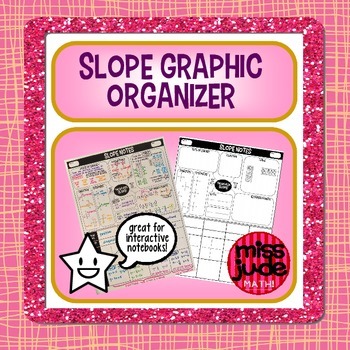
Slope Graphic Organizer Algebra
All-in-one slope notes page is intended to be used as a reference and reminder sheet for students to refer back to throughout a unit. Concepts can be added to the organizer as they are introduced throughout the unit. Includes space to record how to find slope from tables, points & an equation. Slope tells us about rate of change, the direction, and steepness of a graph. Relates types of lines, types of equations & types of slope.
Happy solving from the miss jude math! shop :)
Grades:
7th - 11th
Showing 1-24 of 1,790 results


