1,710 results
Graphing projects
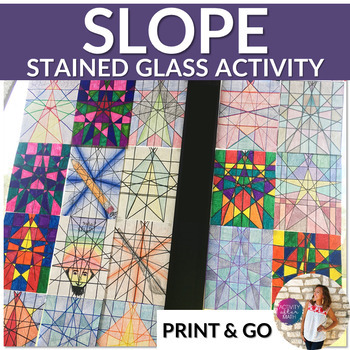
Stained Glass Slope Graphing Linear Equations Slope Intercept Form
Students will graph 18 equations written in slope-intercept form. All four types of slope are included(positive, negative, undefined, and zero). They will then darken the lines and color however they like creating a picture with a stained glass effect. This is a great activity that goes beyond the worksheet! You can save paper by printing the instructions on one side and the graph paper on the other!This resource includes:Student instructions pageGraph paper with the numbers and x- and y-axis la
Grades:
8th - 9th
Types:
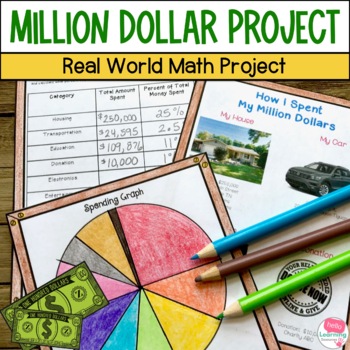
Million Dollar Project - Real World Math Project for Decimals and Money 4th 5th
This million dollar project gives your students a real world math project apply what they have learned about decimals, money, graphing, and percents. This makes a great financial literacy project to help kids understand costs, spending, and where money goes.Open the PREVIEW to see details of what is included.This resource includes:Teacher information and ideas for helpful websites for gathering informationStudent recording sheet for tracking spendingStudent sheet for calculating percentage of mo
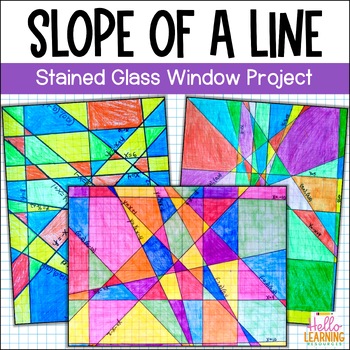
Slope Intercept Form Activity - Stained Glass Slope Project - Coloring Activity
Students will show what they know about slope intercept form, linear equations, and x and y intercepts in this fun and creative stained glass slope project! Perfect to use as an activity or assessment while teaching slope. Great integration of math and art!⭐ This resource includes:teacher activity directionsstudent directions3 linear equation worksheet pages for students to complete that determine the lines they will graphphotos of finished projectssample solution gradin
Subjects:
Grades:
6th - 7th
Types:
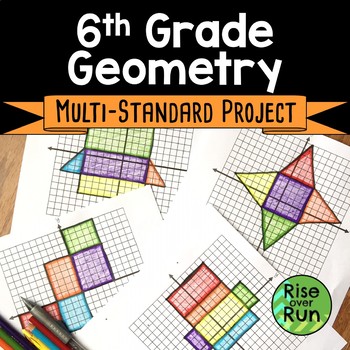
6th Grade Math Geometry Project for End of the Year with Nets and Surface Area
With this project, students must identify nets and 3D figures along with calculating surface area, perimeters, and volume. It is great way to practice several sixth grade standards! Students get hands-on experience working with nets, surface area, and volume. Not only is this activity engaging, but it will help create a conceptual understanding of 3D figures and their attributes. The project has 4 parts and 2 Follow Up practice worksheets. The parts can be assigned to individual students or par
Grades:
6th
Types:
Also included in: 6th Grade Math Activities Bundle
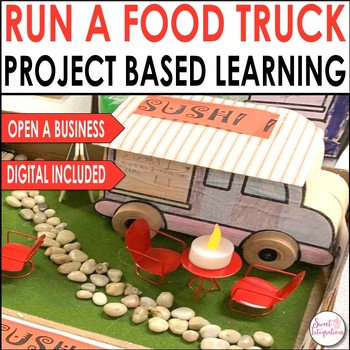
Design and Run a Food Truck STEM With Digital PBL - Project Based Learning Math
Introduce your students to the FOOD TRUCK CRAZE as they master their math and STEM skills through this project based learning math unit. With this math project based learning unit, students will design and run their own food truck! As they plan their final product in this PBL unit, students integrate digital learning by investigating various cultures and diversity and learning about foods from different countries. They will be able to represent a country of their choice, design (STEM) open a fo
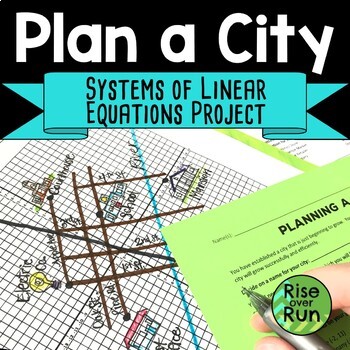
End of Year Math Project Graphing Systems of Linear Equations to Plan a City
Students plan their own city on a Cartesian plane, combining math skills and creativity. Students work in groups using graphing skills to create a city plan. Students will get practice with the following topics:• Graphing equations • Parallel and perpendicular lines • Systems of linear equations Some landmarks and roads are already established in the city. Students will graph these items, and then add their own. Each city will have some features in common, but each one will turn out unique t
Subjects:
Grades:
8th - 9th
Types:
CCSS:
Also included in: 8th Grade Math Activities & Lessons Bundle for the Whole Year
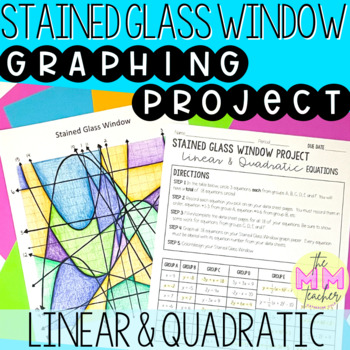
Graphing Linear & Quadratic Equations: Stained Glass Window Project
Stained Glass Window Project: Graphing Linear & Quadratic EquationsThis resource is meant to be used AFTER students have been taught about linear equations AND VERTEX FORM of quadratic equations. I have used this project as an end of the year activity for both Algebra 1 and Geometry. It allows Algebra 1 students to apply standards they have learned throughout the year and it gives Geometry students a chance to refresh their Algebra 1 skills before taking Algebra 2.Students will choose a tota
Grades:
8th - 10th
Types:
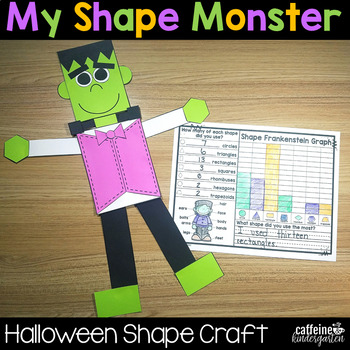
Halloween Math Shape Frankenstein Monster Craft Activity
This shape Frankenstein monster is an ADORABLE Halloween math craft activity that will provide a tactile experience with 2D shapes for your students. Included are multiple versions of data collection to promote further thinking about shapes for different levels and grade levels! Includes graphing and writing activities for cross-curricular learning. All blacklines for copies included. This is a perfect math activity for Kindergarten and First Grade!
Grades:
K - 2nd
Types:
Also included in: Shape Craft Math Bundle
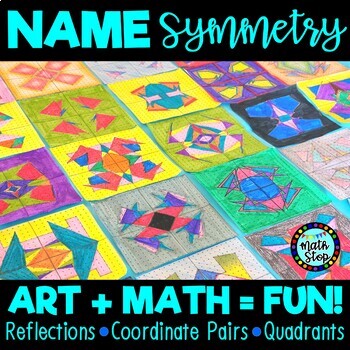
Math Art Activity Name Symmetry | Transformations Reflections Quadrants
A great personalized activity to incorporate art and math. Help your students develop their knowledge of graphing coordinate pairs, quadrants, and reflections about the x and y-axis with this fun and engaging art activity. Great for a geometry lesson plan that is looking to help solidify an understanding of quadrants, symmetry, transformations (reflections), with a cool symmetrical drawing as a finished product. Students personalize their experience by using the letters of their name to decode
Grades:
6th - 10th
Types:
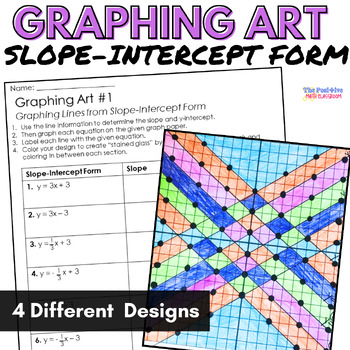
Slope Intercept Form Graphing Activity
Not only will this math art activity help your students practice writing and graphing equations in slope intercept form, but it will also add beautiful stained glass-styled art to your classroom! Best of all, this product includes 4 different options to help you differentiate within your math classroom and can be used for sub plans, extra credit, review, and more! Click here to save money when you purchase this product included in the Graphing Equations Art Bundle After graphing each set of lin
Grades:
7th - 9th
Types:
Also included in: Graphing Linear Equations Art Bundle
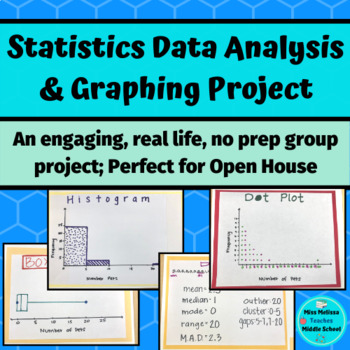
Statistics Project: Data Analysis & Graphing- real life, no prep
This statistics project is intended as a closure for your sixth grade statistics unit and aligns with ALL of the sixth grade statistics and probability common core state standards. In groups, students work together to choose a statistical question to ask the class. Once the class is surveyed, the group works together to create a frequency table, a dot plot, a histogram, and a box and whiskers plot. After creating their graphs, the groups analyze their data by looking at the mean, median, mode ra
Subjects:
Grades:
6th - 7th
Types:
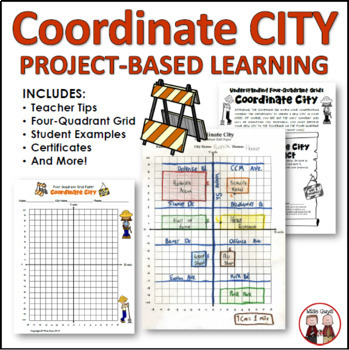
End of Year Math Coordinates City Project
Are you looking for an engaging end of year activity to teach coordinates to your upper elementary and middle school math students? Your upper elementary and middle school students will become engaged as they are asked to design a city based on using a coordinate plane. This is a teacher-friendly resource and minimal prep is involved.This resource contains 9 total documents (12 pages total) that are intended to be a creative math lesson plan that has students create their own city using coordina
Subjects:
Grades:
4th - 6th
Types:
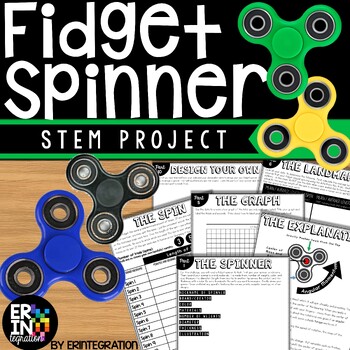
Fidget Spinner STEM Challenge Activities and Science Experiment
The ORIGINAL Fidget Spinner Stem Challenge & Science Lab! Discover the science of fidget spinners with this engaging and low-prep STEM activity. Practice scientific method with an exploration of variables, data collection, graphing, mean/average, and more...all while having fun!This self-paced, fidget spinner activity is print-and-go. Each activity sheet guides students through the project. STEM Challenge Overview:Students will use the included visual directions, graphic organizers, chart
Subjects:
Grades:
3rd - 6th
Types:
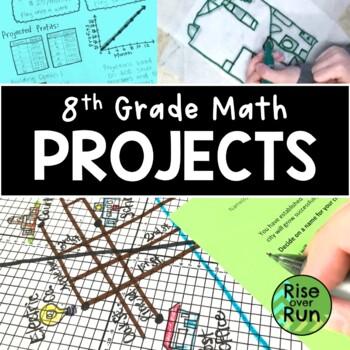
8th Grade Math Projects Bundle for the End of the Year
Want to incorporate more PBL in your lessons? Challenge students to use what they have learned in class as they apply 8th grade standards in these real world application projects. Included are 6 engaging projects:Rates & Proportional Relationships Business Startup ProjectTransformations Architect Design ProjectGraphing Linear Relationships (3 Differentiated Project Topics) Scatter Plots Sports Data ProjectSystems of Equations City Planning ProjectVolume Creative Sculpture ProjectThese are
Subjects:
Grades:
8th
Types:
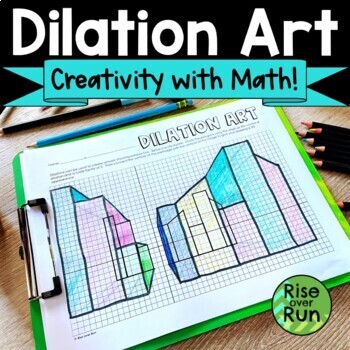
Dilation Activity Creating 3-D Perspective Art
Students explore how dilating images creates 3D perspective artwork in this fun math activity. The first page has a city skyline of buildings on a coordinate plane. Students dilate the figures by a scale factor of 2 to create a 3D drawing. The answer key is included for this page. Next students are given a blank coordinate grid to create their own preimage, which they then dilate by a scale factor of 0.5.This exercise shows students how math can be used to create artwork!This activity could be
Grades:
8th - 10th
Types:
Also included in: 8th Grade Geometry Unit Activities and Lessons
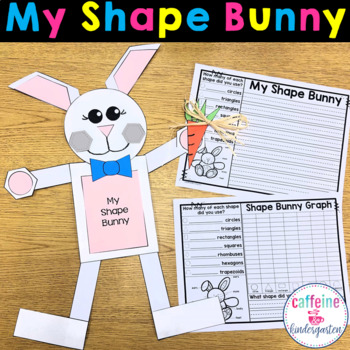
Shape Easter Bunny - Math Craft
This shape Easter Bunny math graphing craft is a super cute and fun way to provide a tactile experience with 2D shapes for your students. Included are multiple versions of data collection to promote further thinking about shapes for different levels and grade levels! Includes graphing and writing activities for cross-curricular learning. All blacklines for copies included.
•••••••••••••••••••••••••••••••••••••••••••••••••••••••••••••••••••••••••••••••••••••Check out these SPRING resources: Shape
Grades:
K - 2nd
Types:
Also included in: Shape Craft Math Bundle
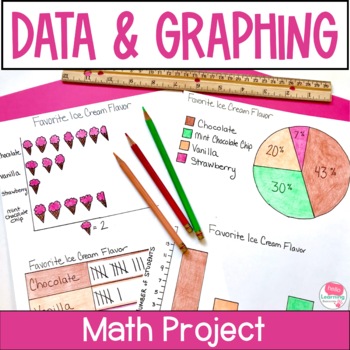
Data and Graphing Project - Real World Math Project Based Learning Activities
This data and graphing project gives your students a meaningful way to apply their data and graphing skills. Use this real world math project as an end of unit activity, enrichment activity or assessment. Easy to use and fun for students!Click the PREVIEW button above to see everything that is included in this fun math project!⭐ This resource includes:teacher information, directions and sample schedulesupply listgrading rubricstudent direction sheettwo data collection sheets (one for open ended
Subjects:
Grades:
4th - 6th
Types:
CCSS:
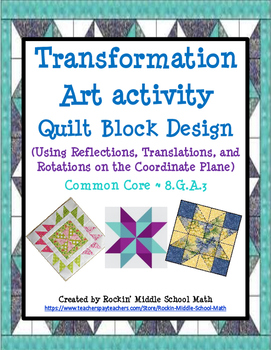
Transformation Art 1 - Quilt Activity/Class project (CCSS 8.G.A.2 and 8.G.A.3)
Translations, Reflections, and Rotations are used to create a beautiful 3-D quilt pattern that students can color using their creativity. No two students will color their design the same way. The purpose of this activity is for students to use the rules of how each transformation effects the coordinates of the pre image resulting in the post image. Reflections and Rotations are done about the Origin. I have included a Cheat sheet that you may give students to assist them and for studying the
Measurement & Graphing Math Project-Based Learning: Paper Airplane Fun
Is it possible for a measurement and graphing project and assessment to be “Print and Go?” It is with this one! This product, by Wild Child Designs, is a two week math investigation, complete with assessment. It is student-tested and ADORED and provides practical application of customary measurement and conversion concepts, as well as graphing concepts (bar graphs, line graphs, line plots, range, median, mode, and mean). It's perfect for fourth or fifth graders.
The steps of this project inc
Subjects:
Grades:
4th - 5th
Types:
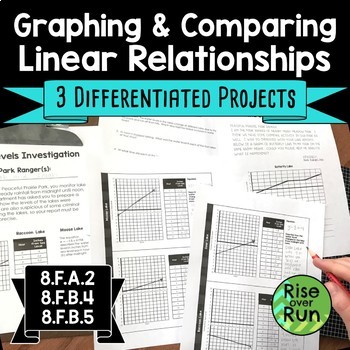
End of the Year Real World Math Project - Graphing Linear Equations
Challenge your students to work with real world linear relationships in these three differentiated, engaging projects. Each project requires students to graph lines, create tables of values, write equations, interpret graphs, compare rates, and compare initial values. The projects increase in difficulty by providing information in different formats, asking more in-depth questions, and allowing creativity. The last project also introduces students to systems. Differentiation can be difficult an
Grades:
8th
Types:
Also included in: 8th Grade Math Activities & Lessons Bundle for the Whole Year
Earth Day Math Project for Graphing and Data Interpretation
This resource is included in PDF format for printing and in Google Slides™️ format for digital learning. This makes it useable with Google Classroom™️.Are you looking for a way to reinforce graphing and data interpretation concepts in an engaging way that helps your students make connections? “Our Earth” is a real-life math project where students will complete eleven different graphing and data-related tasks. These activities can be used as a package, or in isolation. They work great as a math c
Subjects:
Grades:
2nd - 3rd
Also included in: Math Projects & Escape Rooms for Grades 2-3 | Bundle of Ten
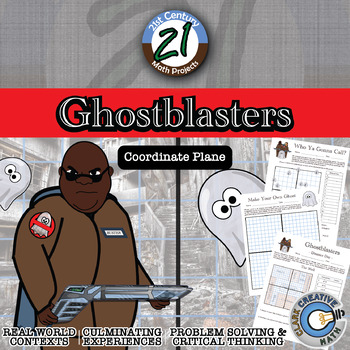
Ghostblasters -- Ordered Pair & Coordinate Plane - 21st Century Math Project
There’s something strange in your neighborhood! Ghosts have managed to escape the capture chamber and have wreaked havoc all over the region. On the case in this 21st Century Math Project is an upstart ghost catching team, the Ghostblasters. Given the ordered pairs on the Ghostblasters radar, find which buildings are infested with ghosts.Blend ordered pair and coordinate plane practice with fun for all!In this 20 page document you will be given a mapping to the Content Standards, an outline for
Grades:
5th - 12th
Types:
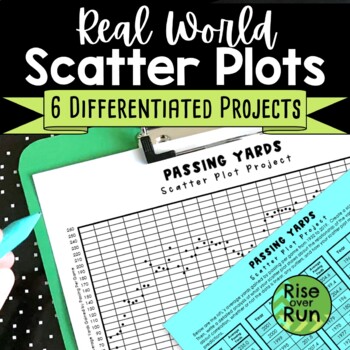
Scatter Plot Project with Real World Sports Data
Practice creating and analyzing scatter plots with these six differentiated real world projects. Students are provided statistics for a sport and must graph the data. Then, they write an analysis describing correlation, whether or not the data is linear, any outliers, and how the scatter plot might be used to make predictions. The scatterplots range from 38 points to 149 points, so they can be used to differentiate. The scatter plots will take a little time to plot, but they result in real
Subjects:
Grades:
8th - 9th
Types:
CCSS:
Also included in: 8th Grade Math Activities & Lessons Bundle for the Whole Year
Transformations on the Coordinate Plane Bundle: Puzzle Art - Common Core 8.G.A.3
Transformations have never been so fun with this high interest, interactive, easily differentiated bundle. It contains 7 transformation activities where students must use the given pre-image points, perform the stated transformation(s), and then plot the new image points to create a figure on the coordinate plane which they can color. Each activity covers a different transformation, or a mixture of several transformations on the coordinate plane. You could easily differentiate by student's nee
Showing 1-24 of 1,710 results

