
Weather Chart Printable K-2nd

The Kinderlady
187 Followers
Grade Levels
PreK - 2nd
Subjects
Resource Type
Standards
CCSSK.MD.A.2
CCSSK.MD.B.3
CCSS1.MD.C.4
Formats Included
- PDF
Pages
4 pages
The Kinderlady
187 Followers
Also included in
 This Weather Chart for Kids Printable & Google Slides combines the Printable and Digital Google slides product of the Kindergarten-2nd grade Weather Tracker Chart for Kids. Please read the directions and comments for the attached products. KEYWORDS: weather chart, weather tracker, kindergarten wPrice $4.50Original Price $6.00Save $1.50
Description
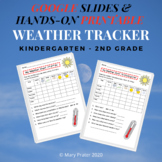
Kindergarten - 2nd Grade Weather Tracker Printable is a visual aid for K-2 to chart daily weather conditions. This can be used as a guided activity for TK-Kindergarten or an independent weather tracker for 1st-2nd grades. The rows list the days of the week and along the top of each column is a box for temperature, precipitation, wind, and sunshine.
On the last day (Friday) there are questions to answer about the week's weather.
There are two charts. One is for TK and Kindergarten which have yes and no questions. The other chart is for 1st - 2nd grade which has more in-depth questions.
Included are color pages along with black and white. These are also great for homeschoolers, they can be laminated and used over and over.
Total Pages
4 pages
Answer Key
N/A
Teaching Duration
1 Week
Report this resource to TPT
Reported resources will be reviewed by our team. Report this resource to let us know if this resource violates TPT’s content guidelines.
Standards
to see state-specific standards (only available in the US).
CCSSK.MD.A.2
Directly compare two objects with a measurable attribute in common, to see which object has “more of”/“less of” the attribute, and describe the difference. For example, directly compare the heights of two children and describe one child as taller/shorter.
CCSSK.MD.B.3
Classify objects into given categories; count the numbers of objects in each category and sort the categories by count.
CCSS1.MD.C.4
Organize, represent, and interpret data with up to three categories; ask and answer questions about the total number of data points, how many in each category, and how many more or less are in one category than in another.
Reviews
Questions & Answers
187 Followers
