7 results
Graphing homeschool curriculum images
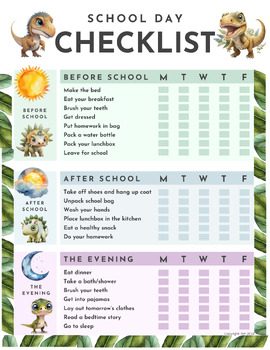
School Day Checklist
✏️ Get ready to ace every school day with our ultimate School Day Checklist – now on sale! Say goodbye to frantic mornings and hello to smooth sailing with our comprehensive checklist designed to streamline your child's routine. Whether you're a teacher, or parent, this checklist is your secret weapon for success! Grab yours now and make every school day a breeze!
Subjects:
Grades:
Not Grade Specific
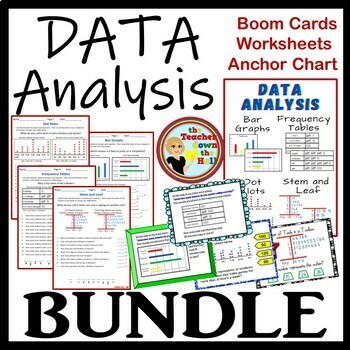
Data Analysis Bundle I Bar Graphs Dot Plots Frequency Tables Stem & Leaf
Do your students need more practice analyzing data? Included in this bundle is a set of 8 self-checking worksheets for independent practice of Data Analysis. All pages have a fun riddle that is answered by answering the questions correctly!Use as formative assessment, center activities, or homework assignments. Kids love to race to find the answers to the riddles!!Here's What's included:Bar GraphsFrequency Tables Dot PlotsStem and Leaf Plots Here's what TEACHERS LIKE YOU are saying about WORKSHE
Subjects:
Grades:
3rd - 5th
CCSS:
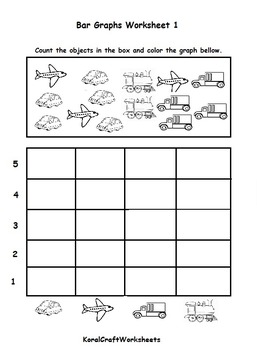
Kindergarten Bar Graph Worksheet 1
A easy way to introduce graphing to preschool and kindergarten students.
Instructions:
Student will count the matching objects and color the bar graph bellow.
Subjects:
Grades:
PreK - K
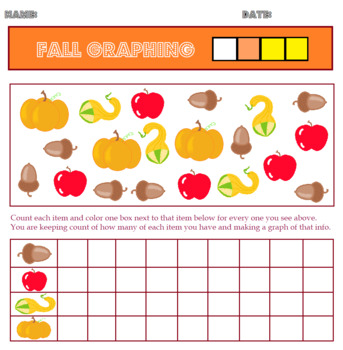
Graphing Fall Fauna
Colorful pictures adorn this awesome graphing worksheet ! The student must graph a gourde, a pumpkin, an acorn, and an apple.
Subjects:
Grades:
PreK - 2nd
Also included in: Halloween Week of Activities
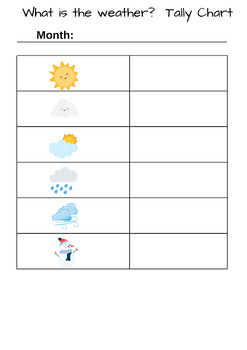
Weather Tally Chart
A weather tally chart for kindergarten and grade one classrooms is a simplified tool designed to introduce young students to basic math concepts and foster observational skills. The chart typically includes columns for weather symbols (e.g., sun, cloud, raindrops, wind, snowman). Each day, students make a tally mark under the corresponding symbol to represent the weather conditions they observe. This not only helps them practice counting and one-to-one correspondence but also introduces them to
Subjects:
Grades:
PreK - 1st
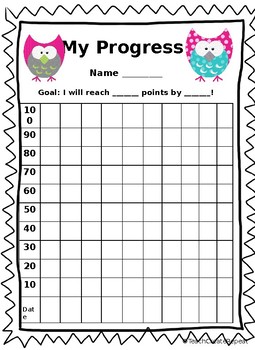
Self-Monitoring Progress Chart
Research shows that students who set goals for themselves and monitor their own progress and more motivated to learn and achieve their goals. These cute charts are a perfect way for students to set goals for themselves and track their own progress. These charts can be glued directly into student folders or used however you wish!
Subjects:
Grades:
1st - 6th
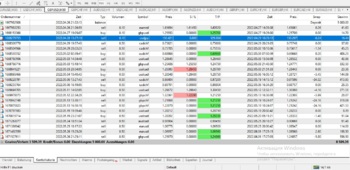
Handel an der Börse nach der Handelsstrategie des Autors
Ein Händler mit 15 Jahren Erfahrung. Ich trainiere den Handel-den Handel an der Börse nach der Handelsstrategie des Autors mit einer Rendite von 10- (konservativer Handel) bis zu 50% (aggressiv) pro Monat. Auf dem Foto die Geschichte des Kontos mit einer Rendite von 70% für den Monat des Handels, ohne unrentable Trades. In persönlicher Korrespondenz werde ich Kontohistorien mit unterschiedlicher Dauer und Rendite bereitstellen.
Grades:
Homeschool
Types:
Showing 1-7 of 7 results


