33 results
Not grade specific graphing interactive whiteboards
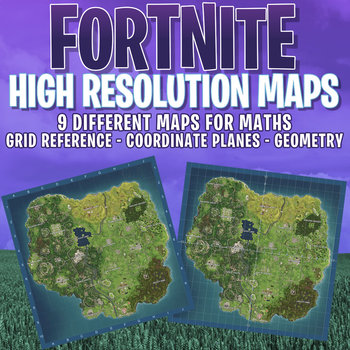
FORTNITE - 9 x MATHS MAPS - GRID, COORDINATE PLANES - HIGHEST QUALITY
THE BEST COLLECTION OF MATHEMATICAL FORTNITE MAPS!An entire collection of the FORTNITE map with different labelling.Each map is an enormous 6000 x 6000 pixels and has been especially reworked for this High Resolution version! You will not find this anywhere else!Perfect for expanding on a Interactive White Board, Projector, Large TV, or even on a personal device!A few of the versions in this incredible collection!- A-J, 1-10 Grid reference Map- Coordinate Plane (Postive (X,Y))- Full coordinate P
Subjects:
Grades:
Not Grade Specific
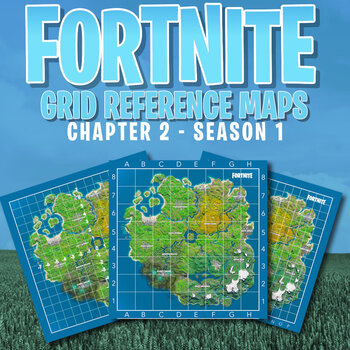
FORTNITE - Grid Reference & Coordinate Plane Maps - Chapter 2 Season 1
Brand new Fortnite maps! Chapter 2 Season 15 x Fortnite maps for printing or large screen displays. Super High Resolution- Blank Fortnite map for your own customisation- Grid Reference - Numbers 0-8 on the axis- Grid Reference 0-8 and letters A-J- Grid Reference 0-16 and letters A - P- Coordinate X and Y axis numbers 7 through to -7.SEE OUR EXCITING NEW FORTNITE WORD PUZZLES HERE!
Grades:
Not Grade Specific

Pixel Art Interactive White Board Activity Create & Design: Middle School
Pixel Art Interactive White Board Activity Create & Design: Middle School
In this resource students can create their own digital pixel art from their favorite video games, animated series, comic book or even create their own original digital pixel art.
Simply select the color pixel from the color pallet on the right side of the screen and drop it into the grid on the right. It is as simple as that.
Be sure to check out the linked resources via the buttons under the color palette for pixel a
Subjects:
Grades:
Not Grade Specific
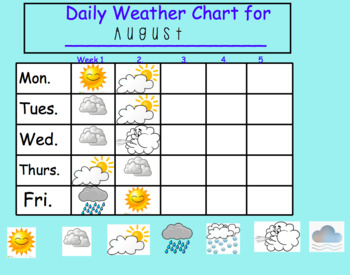
Daily Weather Chart~White Board Resource
This set contains 10 charts for tracking and recording the day's weather. It uses weather symbols that are "infinity cloned" so you never run out. The teacher writes the name of the month at the top and charts the weather by day and week rather than using a calendar. Easy to compare from month to month without taking up classroom space.
Subjects:
Grades:
Not Grade Specific
Types:
Digital Calendars Bundle!!
Get the Bundle and SAVE!!These are blank Calendars that can be used for virtual learning. These are PNG files which means that you can use them as a background image. You will need to add your own text boxes to fill them in. You can also add your own clip art to drag and drop onto the calendars. Enjoy!
Grades:
Not Grade Specific
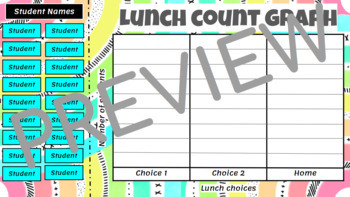
Lunch Count Graph
This is a fun way for students to interact with lunch count. Students will drag their name to their lunch choice, in return they will be creating a graph. This opens up some teaching moments to analyze graphs and data. It would make a perfect morning meeting activity. The teacher could ask questions such as: How many more students want choice 1 over choice 2, How many students are eating lunch provided by the school?, How many more students are getting lunch from school than students who broug
Grades:
Not Grade Specific
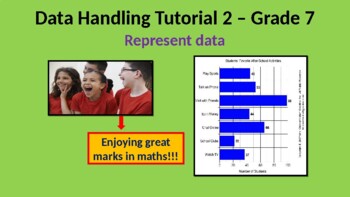
Grade 7 Representing and interpreting data in PowerPoint
Data cycle - problem, plan, collect & organize, represent, analysis & report. Keywords - bar & double bar graphs, histogram, pie chart, frequency tables, representing data, examples, intervals, data set, sectors of a whole, critical reading and interpreting, assumptions, writing paragraphs, summarizing & proposals. Excellent for classroom teaching and for use with a mobile.
Subjects:
Grades:
6th - 8th, Not Grade Specific
Also included in: Grade 7 Maths Data handling in animated PowerPoint.
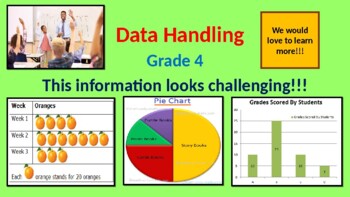
Grade 4 Data handling in PowerPoint
collection & handling of data, key words, different graphs - bar, pie charts & fractions, data cycle, assignment, experimentation & probability. Excellent for classroom teaching with a data projector and for use on a mobile phone.
Subjects:
Grades:
3rd - 5th, Not Grade Specific
Also included in: Grade 4 Maths Space, shape and data handling in animated PowerPoint.
Grade 7 Data handling - probability in PowerPoint
History, gambling, outcomes, experiments, event, frequency, possible outcomes, tallies, equal chance, formula for probability, example test question. Excellent for use in classroom with data projector and for use on mobile phone.
Subjects:
Grades:
6th - 8th, Not Grade Specific
Also included in: Grade 7 Maths Measurement and probability in animated PowerPoint.
Grade 7 Collecting, organizing, summarizing and using data in PowerPoint.
Data cycle, what is data, sources, examples, keywords - data, population, sample, questionnaires & questions, raw data, frequency table, tallies, intervals, range of data values, completing tables, stem-and- leaf method, exercises, maths percentages, working with intervals, summarizing data - mode, median, bi-mode, mean, measures of dispersion, range, central tendency, formula for mean, measuring dispersion. Excellent for classroom teaching wit a data projector & for use on a mobile.
Subjects:
Grades:
6th - 8th, Not Grade Specific
Also included in: Grade 7 Maths Data handling in animated PowerPoint.
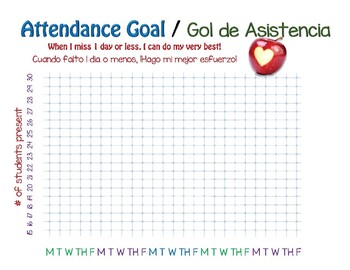
Classroom Attendance Poster Chart
This English/Spanish Attendance chart can be printed in poster size, or any size you might need to graph and chart your students daily and monthly attendance. Works great for morning meetings to help your students improve their classroom attendance.
Subjects:
Grades:
Not Grade Specific
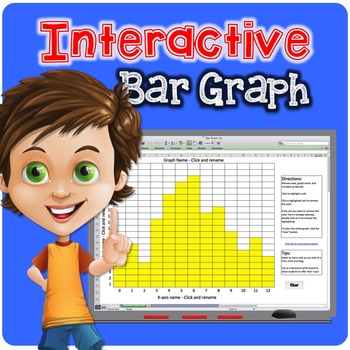
Interactive Bar Graph or Histogram
Brand New! FREE! Graphing has never been so fun! Perfect for Smart Board or Promethean Board graphing! Simply click on a cell to highlight it. Click again to un-highlight it, or press clear to remove all of the input! Use over and over again!
Completely customizable. Change the x- and y-axes names as well as the bar graph name and even the numbers lining the axes. Create bar graphs or histograms depending on how you customize it!
Please note, this is a Microsoft Excel file. In order to use thi
Grades:
Not Grade Specific
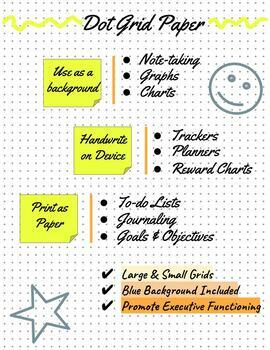
Dot Grid Paper for Bullet Journal, Charts, or Graphing
Dot grids promote flexible thinking as well as flexible teaching in all subjects. Students and teachers easily create graphic organizers for note-taking, writing, essay planning, research, or literary analysis. Use in math for graphs, charts, and problem solving. Teach executive functioning with dot grid paper as an easel for planning, calendaring, to-do lists, goal setting, and more! Directly write on a device, use as a background, or print. Four dot grids are included: high density in white
Subjects:
Grades:
Not Grade Specific
NGSS:
HS-ESS3-5
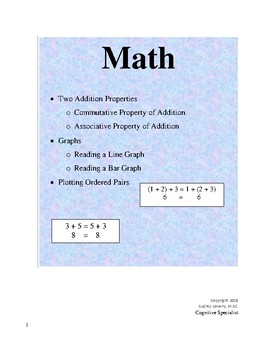
Graphs -Interpretation
This lesson includes how to read a graph and interpret the data. It also includes a lesson or ordered pairs. I did not mark a grade level because a teacher can use it at any level where the concept of graphs is taught.
Subjects:
Grades:
Not Grade Specific
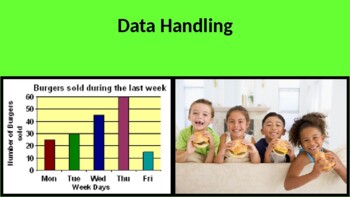
Grade 6 Data handling and probability in PowerPoint
Collecting and organizing data, key words, questionnaires, data & tables, tallies, working with pictograms, single & double bar graphs, drawing single and double bar graphs, mode & median of a set of data, interpret graphs, working through a data cycle, interpret and analyze data, compare graphs on the same topic, probability, key words, experiment, trial & outcomes, tossing a coin, throwing dice, spinning a wheel, frequency, scale of probability. Excellent for classroom teachin
Subjects:
Grades:
5th - 7th, Not Grade Specific
Also included in: Grade 6 Maths Measurement and data handling in animated PowerPoint.
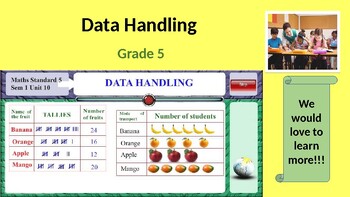
Grade 5 Data handling & probability in PowerPoint
Collecting & organizing data, pictogram, graphing, ordering & finding the mode, modal number, ascending and descending orders, data handling cycle, data cycle in practice, presenting, analyzing & reporting data, key words, assignment, probability, outcomes & experiments, recording experiments.
Subjects:
Grades:
4th - 6th, Not Grade Specific
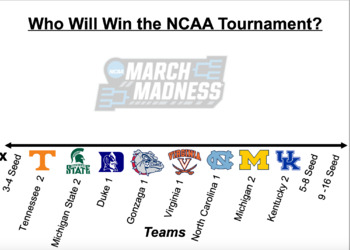
NCAA March Madness 2019 Smart Notebook Line Plot
This product is an interactive line plot using Smart Notebook software. You must have access to Smart Notebook and/or be able to access Smart Notebook Express online in order to utilize this product!Students can use this line plot to vote on the team they think is going to win the NCAA tournament! You can use this product to discuss probability and also to reinforce the skill of line plotting.
Subjects:
Grades:
Not Grade Specific
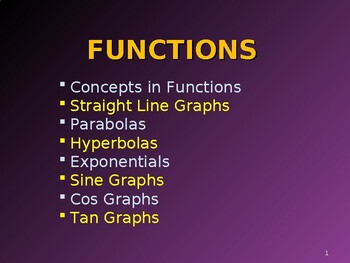
Grade 10 Maths: Functions in PowerPoint
Concepts in functions, straight line graphs, parabolas, hyperbolas, exponentials, sine graphs, cosine graphs, tan graphs, examples and exercises. Excellent for classroom teaching with a data projector & for use on mobiles.
Subjects:
Grades:
9th - 11th, Not Grade Specific
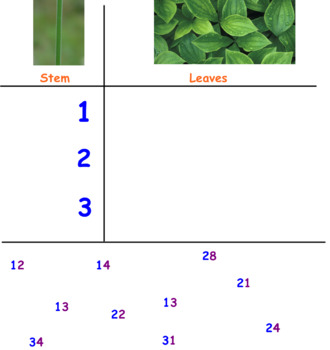
Stem and Leaf Plots
Interactive Notebook lesson plan to teach stem-and-leaf plots
Subjects:
Grades:
Not Grade Specific
Types:
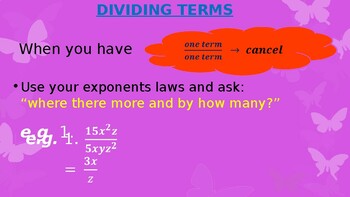
Grade 8 Maths 2b Patterns, functions and algebra in PowerPoint.
Terms continued, squares & cubes, square and cube-rooting, steps to solve equations, exponential equations, equations & tables, equations & word problems, graphs - linear, non-linear, features, cartesian plane, point plotting, great exercises & sample questions. Excellent for classroom teaching with a data projector & for use on mobiles.
Grades:
7th - 9th, Not Grade Specific
Also included in: Grade 8 Maths Patterns, functions and algebra in animated PoweerPoint.
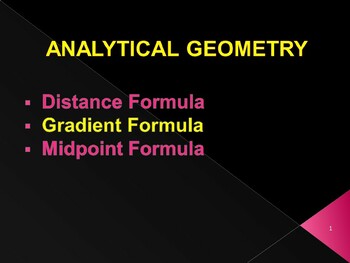
Grade 10 Maths: Analytical geometry in PowerPoint
The distance formula, the gradient formula, the midpoint formula, rise over run method, horizontal lines, vertical lines, parallel lines & a challenge. Excellent for classroom teaching with a data projector & for use on mobiles.
Grades:
9th - 11th, Not Grade Specific
Also included in: G 10 Maths: Analytical and Euclidean geometry in animated PowerPoint.
Grade 8 Maths 5b Handling data in PowerPoint.
Representing, interpreting, analyzing & reporting data - bar graphs, double bar graphs, histograms, pie charts, broken line graphs, probability, calculations, examples & great exercises. Excellent for classroom use with a data projector and for use on mobiles.
Grades:
7th - 9th, Not Grade Specific
Also included in: Grade 8 Maths Data handling in animated PowerPoint.
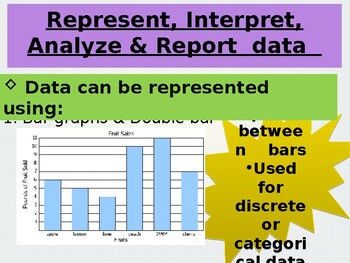
Grade 9 Maths 5b Data handling in PowerPoint.
Representing, interpreting, analyzing & reporting data, histograms, pie charts, broken line graphs, scatter plots, probability, compound events, tree diagrams many examples & great exercises. Excellent for classroom teaching & for use on mobiles.
Grades:
8th - 10th, Not Grade Specific
Also included in: Grade 9 Maths Data handling in animated PowerPoint.
Grade 10 Maths: Euclidean geometry in PowerPoint.
Lines & angles, properties of triangles, congruent triangles, similar triangles, quadrilaterals, sum of angles in a triangle, Pythagoras, mid point theorem etc. Excellent for classroom teaching with a data projector & for use on mobiles.
Subjects:
Grades:
9th - 11th, Not Grade Specific
Also included in: G 10 Maths: Analytical and Euclidean geometry in animated PowerPoint.
Showing 1-24 of 33 results


