67 results
Not grade specific graphing resources for Microsoft Word
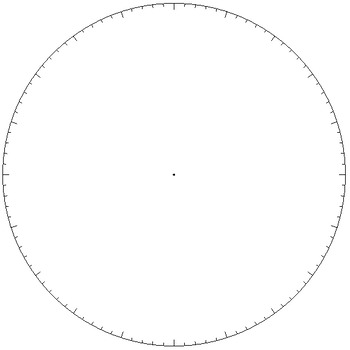
Pie Chart / Circle Graph - Simple Template
Pie graphs can be tricky to make by hand when the sections aren't easy fractions of the pie. This simple template gives a circle marked off with 100 'tick lines' for easy graphing of percentages of the whole pie. A second template using dots is included too. A dot in the centre of the circle is included too, making it easy to use a ruler and draw lines out to the edge.
It's a .docx (Word) file containing two images. Feel free to copy, paste, modify, distribute, embed...
~CalfordMath
If
Subjects:
Grades:
Not Grade Specific
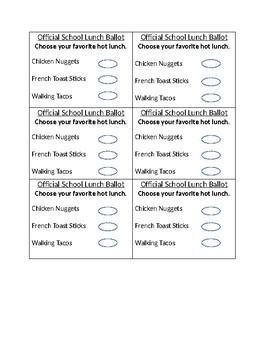
Editable Election Lunch Ballot
This is an editable Election Ballot that can be used as a fun school wide activity while learning and participating in an election. Teachers can facilitate or an upper grade could facilitate and it could be an project.
Subjects:
Grades:
Not Grade Specific
Types:
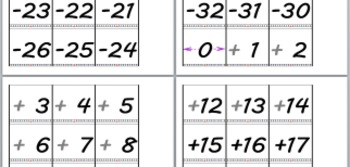
Numberline Positive Negative Integers -32 to +32 number line bulletin board size
FINALLY! A decent number line for teaching positive and negative numbers and beginning addition and subtraction of integers. Really, this is the bomb. I have used it.
Simple but not too simple, big enough to see, enough numbers to help learn to add and subtract, but not enough to take up all the wall space you have. Print and cut into rows of three numbers each.....then just tack them up. All done!
Comes with a sign about how signs interact in operations.
This is a large font posi
Grades:
Not Grade Specific
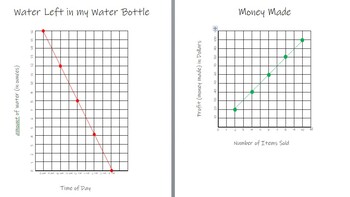
Linear Graphs Simplified for Special Education
I was in need of simplified graphs for my special education students. I made these up so they could learn the content with information relevant to their lives. This document includes ideas on how to teach the following concepts: x- and y- coordinates, covariation, direction of covariation, and rate of change. It includes nine original graphs with plotted points, the same graphs blank for your own graphing, graphs to discuss the direction of covariation, multiple choice worksheets for each gra
Subjects:
Grades:
Not Grade Specific
Types:
Winter Themed Holiday Glyphs
These themed holiday glyphs include an elf, snowman, and reindeer. Use these glyphs as a single lesson on data collection, or refer back to them again and again. These engaging glyphs address skills like following instructions, collaboration, data collection, and analytical skills. Whether you are a seasoned vet with glyphs or trying them for your first time these FULLY CUSTOMIZABLE glyphs can be altered to fit the needs of any class or grade.
Subjects:
Grades:
Not Grade Specific
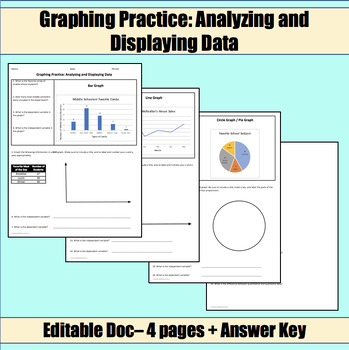
Graphing Practice: Analyzing and Displaying Data
In this Graphing Practice: Analyzing and Displaying Data Activity, students will be able to practice analyzing different graphs, as well as make their own graphs based on information they are given. This includes an opportunity to practice with: Bar GraphsLine GraphsCircle Graphs / Pie GraphsThis Graphing Practice: Analyzing and Displaying Data Activity can be used as:Introductory LessonNotesSub lesson / reviewStation workIndependent workHomeworkCheck out my other introduction to science lessons
Subjects:
Grades:
Not Grade Specific
Types:
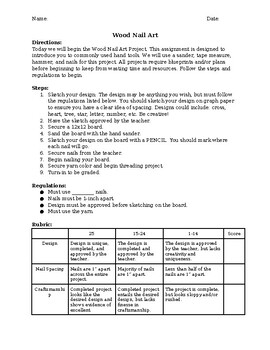
Wood Nail Art Project
The Wood Nail Art Project is a multi-day assignment to introduce students to using hand-tools. The directions, steps, regulations, and rubric are included on the assignment.This is a hit every year with my students! I like to assign between Thanksgiving and Christmas so they can make projects for loved ones. I hope you enjoy!
Grades:
Not Grade Specific
Types:
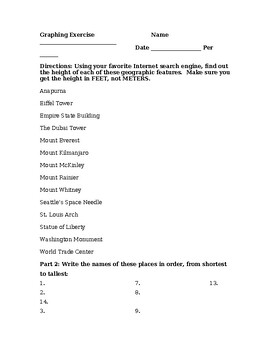
Bar Graph Practice
This item helps students practice making bar graphs. First, they use the internet to find out the height of multiple famous structures like the Statue of Liberty, Mt. Whitney, and Mt Everest. Then, they put the items in order by height and draw a bar graph showing the contrasts. This usually took two 65-minute class periods.(This could be used as an extra activity with Holt Literature & Language Arts' tenth-grade story "Into Thin Air.")
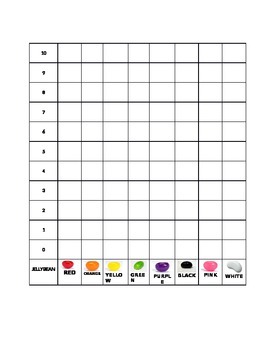
Jellybean Graphing
Students will learn to use graphs to get information. Students will sort jelly beans by color, identify number of each jelly bean and represent this on a graph. Students will use a graph to respond to questions. They will also pair up with a partner and compare results of their data!
Calendar, Weather Graph, Journal, and Personal Information Unit for 2014-15
This unit contains calendars for each month from September 2014-August 2015. Each calendar has questions below to answer about the calendar. There is a cover sheet for each month. We use this with our life skills 7th and 8th graders, but this could be used for regular education students in lower grades. We make a packet each month that has a calendar page and a journal page for each school day and one weather graph in the front, right behind the cover sheet. They complete the weather graph
Subjects:
Grades:
Not Grade Specific
Types:
Math Booklet - Handling Data
This 9 page booklet is designed to help students and parents when with mathematical questions within their class and homework be it in Maths, Science, Geography, etc.. Topics Include:
Tables
Bar Graphs
Line Graphs
Scatter Graphs
Pie Charts
Averages
Subjects:
Grades:
Not Grade Specific
Blank Graph - for Pictographs and Bar Graphs
An editable Blank Graph for Pictographs and Bar Graphs.Emphasizes:-Title-Headings-Labels-Space for Pictures or BarsDo you like this resource? Well then...Consider following my store and checking out other math resources:LexPDesigns StoreAnd giving my shop a follow will give you updates on new products! Are you looking for resources for remote learning?Boom Cards™Math - Google FormsMath - Interactive Google Slides™ ActivitiesJeopardy Game - Google Slides™Mystery Puzzle MathReveal Picture - Googl
Grades:
Not Grade Specific
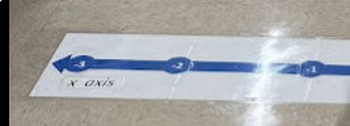
Graphing Editable Giant Coordinate Plane for Floor or Wall with Lesson Plan
This giant coordinate plane helps students learn to graph ordered pairs and visualize the origin. Format was created on Microsoft Word. This download has numbers zero through three, but it is editable to enlarge or duplicate and add more numbers. I tape this one to the floor (about one square tile apart) and my students graph with whole body movements. The kids love jumping to graph. Once mastered, they enjoy quizzing each other with ordered pairs and graphing larger numbers around the room. It
Subjects:
Grades:
Not Grade Specific
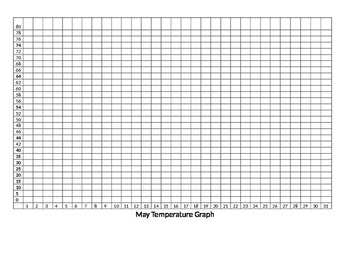
Temperature Graph
Can be modified per month depending on degrees or target counting
Subjects:
Grades:
Not Grade Specific
Types:
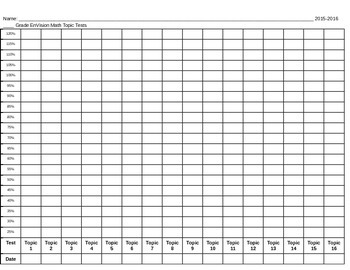
EnVision Math Topic Bar Graph Tracking Assessments
Help students to visually track and view their assessment progress. This bar graph lets students color in their Topic test percentages to view their progress through the year.
Subjects:
Grades:
Not Grade Specific
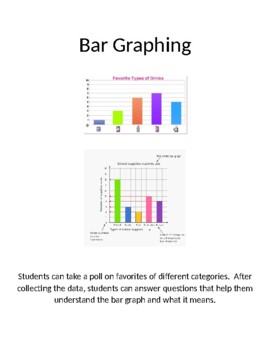
Bar Graphing Activities
Activities to practice bar graphing and questions that help the students understand the use of a bar graph. The activities is taking a poll on group favorites - these include favorite fruit, favorite drink, favorite cookie, favorite class, and favorite type of pet. Each bar graph comes with questions. Depending on the ability of the student, there are two versions of the questions - one version is for students to circle the answers and one version is for students to write the answers.
Subjects:
Grades:
Not Grade Specific
Types:
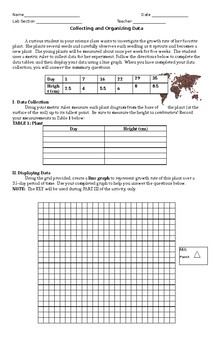
Collecting and Organizing Data: Graphing Practice
Students will be asked to read a scenario and engage in a graphing activity on plant growth. The analysis questions are geared towards the scientific method and increasing validity in an experiment.
Enjoy!
Grades:
Not Grade Specific
Types:
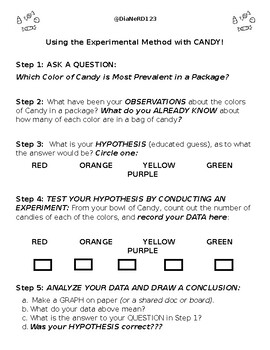
Experimental Method with CANDY! Student and Instructor Resources, Editable
The objective of this editable lesson is to demonstrate the steps of the Experimental method. This lesson can be done face-to-face or online, asynchronous or synchronous. Answers to all questions can be posted to your Virtual Classroom platform. I have used shared docs (e.g. Google Docs and Sheets) and Discussion Forums to do this online / virtually. You could do this synchronously using Zoom or other video-type platforms with polling or other similar tools as well to gather student answers / da
Grades:
Not Grade Specific
Types:
Also included in: (Food) Science Bundle!
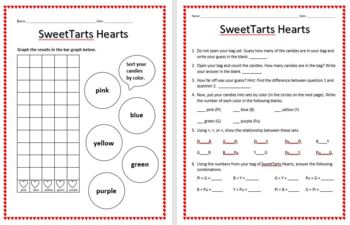
Valentine's Candy Graphing Activity (Abeka Compatible)
A fun way to practice comparing numbers and creating bar graphs using little bags of SweetTart Heart candies. My students absolutely love this activity!
Subjects:
Grades:
Not Grade Specific
Types:
Grids and activities for B-Bot
Great activity for following and giving directions. Can use with or without a B-Bot.
Grades:
Not Grade Specific
Types:
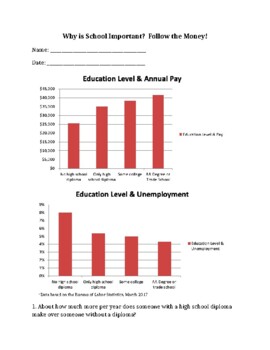
Why is School Important? Follow the Money!
The worksheet allows students to practice reading information from a bar graph, as well as learn about the importance of staying in school in terms of employment and career earnings.
Subjects:
Grades:
Not Grade Specific
Types:
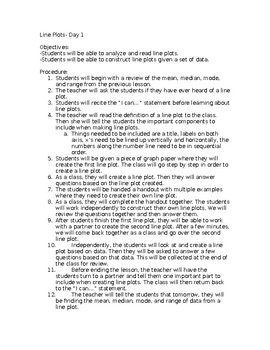
Line Plots Informal Lesson Plan
Lesson plan for the introduction of line plots.
Subjects:
Grades:
Not Grade Specific
Types:
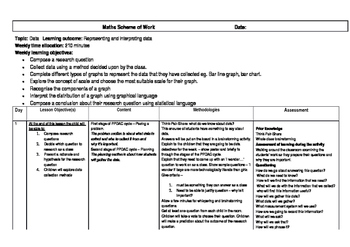
Maths Weekly Scheme
Maths scheme of work over five day period using the PPDAC cycle.
Lessons laid out day-by-day, divided into the following sections weekly and daily objectives, content, methodologies, reources, and assessment.
Subjects:
Grades:
Not Grade Specific
Types:
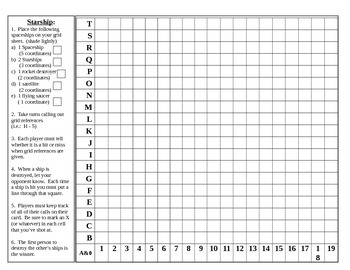
StarShip (Battleship) Gameboard and Instructions
This is a gameboard for students to play StarShip on. The game is played identically to Battleship. Good for fun, or for practicing coordinate graphing skills. The instructions are right on the side of the board.
Showing 1-24 of 67 results


