64 results
Not grade specific graphing resources for Microsoft PowerPoint
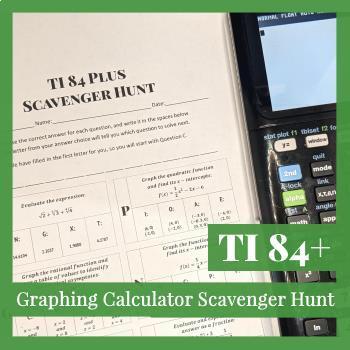
Graphing Calculator Lesson and Activity for the TI-84 Plus
Graphing Calculator Scavenger Hunt for the TI-84+ Start the year off right! With this ready-to-go lesson, you can teach the foundational calculator skills students will need in all of their math classes in just 1-3 days. Topics include:Evaluating ExpressionsRadicals (Square Roots, Cube Roots, etc.)Fractions vs. DecimalsScientific NotationDegrees vs. RadiansGraphing Linear FunctionsGraphing Quadratic FunctionsGraphing Rational FunctionsFinding x-Intercepts/RootsFinding the VertexFinding Vertical
Subjects:
Grades:
Not Grade Specific
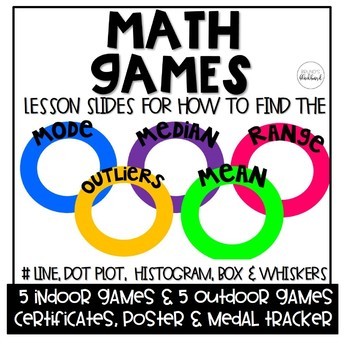
Math Games: Mean, Median, Range, Outliers & Graphs
Math Games
Students will learn how to find the mean, median, mode, range, range playing Olympic style games while practicing and creating Number Lines, Box Plot, Histograms and Box and Whiskers graphs.
This product is a zip file that contains a PowerPoint teaching how to find the mean, median, mode, range, outliers, number plot, dot plot, histogram, box and whiskers, 10 games and an editable create your own game. As well, a PDF file which has posters, awards and placing ribbons. Plus, 2 folda
Subjects:
Grades:
Not Grade Specific
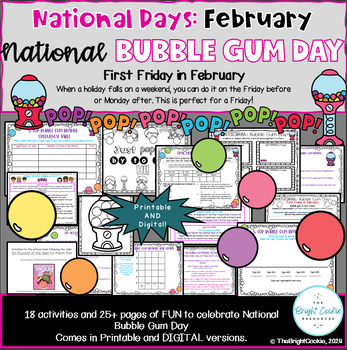
National Bubble Gum Day: Feb. 2nd- Differentiated Math and Engaging Activities
National Bubble Gum Day is celebrated on the first Friday of every February. What a great way to implement some academics AND ENGAGING FUN by using this National Bubble Gum Day resource that provides 18 activities with 25+ pages in all. Both printable and digital versions are provided for most activities. Additional resources with the picture book companion: On the Account of the Gum by Adam Rex)This resource includes: · What is National Bubble Gum Day? Page· Bubble Gum Timeline page· World Rec
Subjects:
Grades:
Not Grade Specific
Types:
Also included in: February National Days: BUNDLE- Engaging and Differentiated FUN!
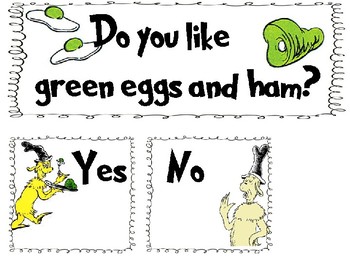
Green eggs & Ham Answer Cards
Comes with a headliner and yes/no cards. Each yes/no card has a space where a child can write their name. These are great for class graphs/prediction charts and more. These are not currently digitally editable. This is for personal use only. For questions or tor request a custom listing, please email page394creations@yahoo.complease note that the clipart used in this product is the sole property of their original creator. I do not own, nor do I claim copyright to any of the images used in this p
Subjects:
Grades:
Not Grade Specific
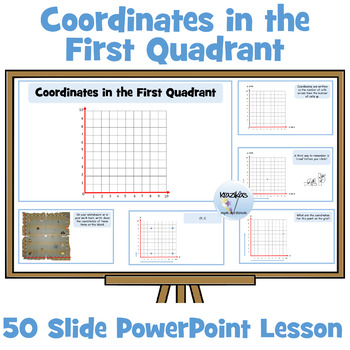
Coordinates in the First Quadrant
This is a highly visual and interactive 50-slide PowerPoint lesson on coordinates in the first quadrant. The PowerPoint explains and visually demonstrates the following:gridsx and y axesthe originhow to locate coordinateshow to plot coordinateshow to write coordinatesOpportunities are provided within the PowerPoint for students to locate and plot coordinates.You may also be interested in:Coordinates in the First Quadrant Differentiated WorksheetsThis resource is a set of 24 differentiated worksh
Grades:
Not Grade Specific
Types:
Also included in: Coordinates in the First Quadrant
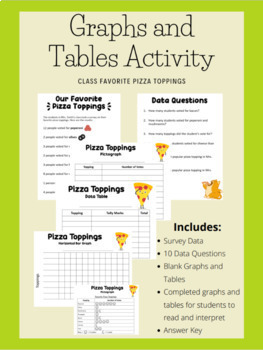
Favorite Pizza Toppings - Graphs and Tables
This is a great resource to help students learn how to read and interpret data in graphs and tables, as well as represent data in graphs and tables. The activity is adaptable to fit what you are working on with your students. It is appropriate for grades 2nd-4th, as well as special education students working on graphs and tables.This activity includes:-written data from a survey on favorite pizza toppings-blank pictograph, data table, vertical bar graph, and horiztonal bar graph-completed pictog
Subjects:
Grades:
Not Grade Specific
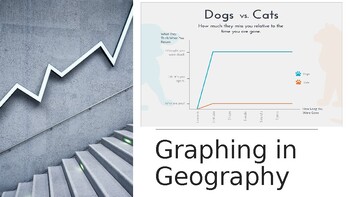
Graphing in Geography (3 different types)
Students will learn how to to put data into 3 different types of graphs (X/Y Scattergraph, Pie Chart, and Proportional area graphs with examples and a final task.
Subjects:
Grades:
Not Grade Specific
Math Grid Notebook For School Editable
Math Grid Notebook for School EditableKids can learn number writing, addition, subtraction and multiplication.Hight school students can use it for graph, Coordinates etc.Size = Letter size 8.5" X 11"With and without margin.Black and white and in blue color.Ask me I will change the color.
Grades:
Not Grade Specific
Types:

Data Handling: Traffic Nightmare Tally and Bar Charts Project
A fantastic and very comprehensive resource including a Traffic Nightmare project book, lesson plan, student objective sheets, PowerPoint extended data collection exercise, PowerPoint Tally Chart Bingo, student bingo sheet and a PowerPoint introduction to using tally charts.
This project focuses on a scenario where the opening of a local supermarket has resulted in a great increase in heavy traffic through a residential area. The students tally the vehicles they see on screen to 'prove' the incr
Subjects:
Grades:
Not Grade Specific
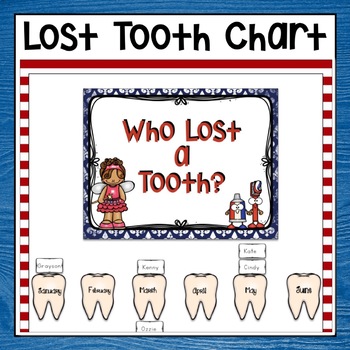
LOST TOOTH GRAPH CHART BULLETIN BOARD DISPLAY
This Lost Tooth Graph is a quick and easy way to celebrate each time your students lose a tooth. With this fun display, you will receive:• "Who Lost a Tooth?" heading (2 sizes)• Editable tooth for each month Frame to display each students' name The frames stack up to create a bar graph that you can use to collect and analyze tooth data during the school year. This is editable so you can type the students' names into each box. Check out the preview for more information! This set is part of m
Grades:
Not Grade Specific
Also included in: NAUTICAL THEME CLASSROOM DECOR *HUGE* EDITABLE BUNDLE
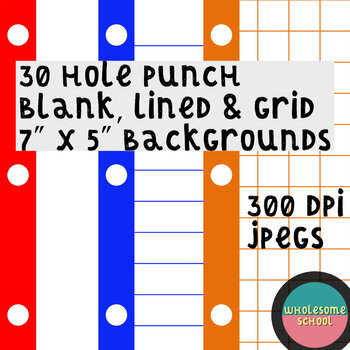
30 JPG Hole Punch Backgrounds | 3 styles (blank, lines, grid) | 10 colors each
In this digital "paper" pack you get a total of 30 JPG files that are 7 inches x 5 inches which are the perfect size/ratio for Boom Cards™! These backgrounds can also be used in Microsoft PowerPoint and Google Slides; you may have to adjust the size of the slides.There are 3 design styles (blank, lines and grid/quad). Colors per each design: black, blue, gray, green, orange, pink, purple, red, teal & yellowThe files are zipped into a single .zip folder so you'll need to be able to unzip the
Grades:
Not Grade Specific
Also included in: BUNDLE of Backgrounds & Borders for BOOM cards, PPT, Slides, etc.
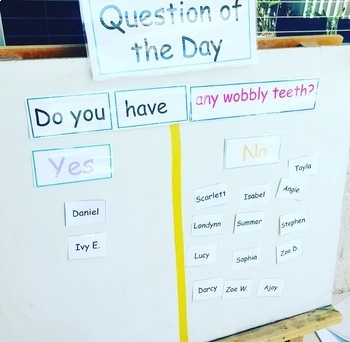
Question of the Day Bundle 150+ Questions
Question of the Day Bundle for Preschool, Pre-K,Kindergarten and PrePrimary.Over 150 editable questions for you to use in your classroom along with a table to insert your students names. This is the perfect way for students to enter your classroom and self register. We then use the question during circle time to start discussions and also practice our counting and graphing. Simply print it out, laminate it and adhere velcro, blutac or a magnet to the back of your students names and the questions
Subjects:
Grades:
Not Grade Specific
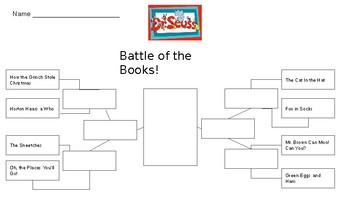
Dr. Seuss Book Battle!
Have your students make a prediction of what their class (or schools) favorite Dr. Seuss book will be by completing a bracket. There is a high level with words only or a low version with pictures (and a cut and paste option for nonwriters). Then have your students complete the survey page by asking peers or teachers. Finish this lesson by having them create a bar graph with their results!!
Subjects:
Grades:
Not Grade Specific
Types:
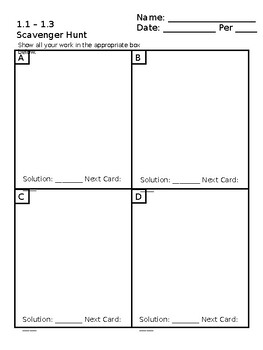
Geometry 1.1 - 1.3 Scavenger Hunt
Are you ready to embark on an exciting journey through the world of geometry? Our Printable Scavenger Hunt is the ultimate educational adventure that will turn learning geometry tools and concepts into an engaging and immersive experience. What's Included: Naming Conventions: Explore the naming conventions for points, lines, planes, segments, rays, and angles. Learn the language of geometry and master the art of precise communication. Identify and Classify: Put your knowledge to the test by iden
Grades:
Not Grade Specific
Types:
Transformations Bundle (dilations, reflections, rotations, and translations)
This product is a unit to teach understanding of transformations. It includes a PowerPoint presentation (66 slides) to enable students to understand transformations conceptually. A student foldable (12 pages) of the four different transformations that is built to accompany the PowerPoint presentation is included. Eight different worksheets (two each for each type of transformation) are included as well as a handout of coordinate grids to use with the additional practice in the PowerPoint presen
Grades:
Not Grade Specific
Graphing Basics Slideshow
This slideshow takes students through the basics of learning how to graph bar and line graphs. This presentation includes vocab, steps to create a graph, and practice graphs.
Grades:
Not Grade Specific
Math Sparks: Data Analysis PowerPoint and Student Notes Newly Revised
Do you need a little spark to your math lessons? Math Sparks - Data Analysis will give your students just that!This easy to use, NO PREP PowerPoint reviews key facts and rules about graphs and charts.Newly revised with PowerPoint Corrections, Condensed Student Notes with Fast Facts already entered (a great time-saver), and Bonus Worksheets!Topics include: Reading a Table, Using Numbers in a Table, Using a Price List, Finding Mean/Median/Mode, Working with Graphs, Reading a Circle Graph, Reading
Subjects:
Grades:
Not Grade Specific
Also included in: Math Sparks Bundle Two! Basic Math Skills! $$ Savings!
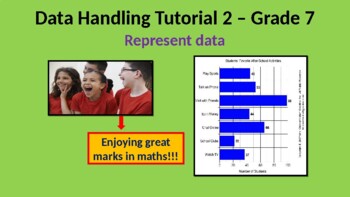
Grade 7 Representing and interpreting data in PowerPoint
Data cycle - problem, plan, collect & organize, represent, analysis & report. Keywords - bar & double bar graphs, histogram, pie chart, frequency tables, representing data, examples, intervals, data set, sectors of a whole, critical reading and interpreting, assumptions, writing paragraphs, summarizing & proposals. Excellent for classroom teaching and for use with a mobile.
Subjects:
Grades:
6th - 8th, Not Grade Specific
Also included in: Grade 7 Maths Data handling in animated PowerPoint.
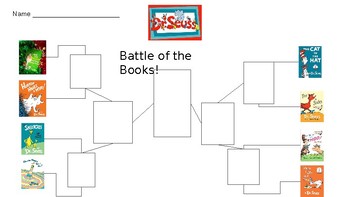
Dr. Seuss Graphing and Money Activities
This is a two part product! The first is a "Battle of the Books" where students fill out a bracket of what they predict their class (or schools) favorite Dr. Seuss book is. There is also a survey sheet and then a bar graph where they can chart their results. The second part includes three sheets related to money skills. The first one, students have to compare money amounts in regards to Dr. Seuss books. Then there is books with costs and students need to show the amount of money using real bills
Subjects:
Grades:
Not Grade Specific
Types:
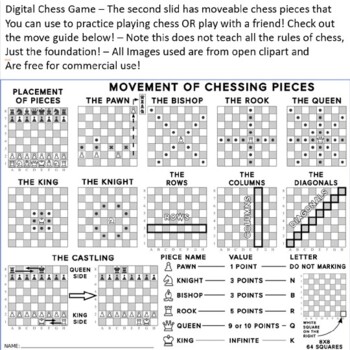
Playable Digital Chess Board
Product is literally just a playable digital chessboard. This product DOES NOT include rules of how to play or how to win, but does include the different moves that all chess pieces are capable of doing.
Subjects:
Grades:
Not Grade Specific
Types:
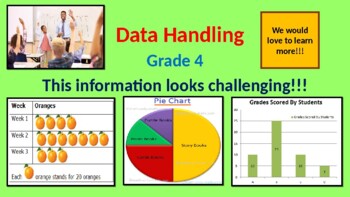
Grade 4 Data handling in PowerPoint
collection & handling of data, key words, different graphs - bar, pie charts & fractions, data cycle, assignment, experimentation & probability. Excellent for classroom teaching with a data projector and for use on a mobile phone.
Subjects:
Grades:
3rd - 5th, Not Grade Specific
Also included in: Grade 4 Maths Space, shape and data handling in animated PowerPoint.
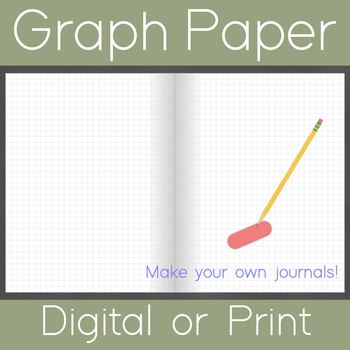
Graph Paper (Use as digital or make copies, 2 colors)
Graph Paper (Use as digital or make copies, 2 colors)Paper (Graph Paper blue and black/gray scale)Uses: see photos for some ideas of uses.* digital format to be displayed in classroom digitally or print a copy.* you can insert text or use the draw tool to write with a digital pen and device.* print for students to use for academic activity, three scales dark, medium, and light. You will receive:Digitally drawn high grade graph paper in blue and in black/gray scale.• 2 Power Point FilesTERMS
Subjects:
Grades:
Not Grade Specific
Grade 7 Data handling - probability in PowerPoint
History, gambling, outcomes, experiments, event, frequency, possible outcomes, tallies, equal chance, formula for probability, example test question. Excellent for use in classroom with data projector and for use on mobile phone.
Subjects:
Grades:
6th - 8th, Not Grade Specific
Also included in: Grade 7 Maths Measurement and probability in animated PowerPoint.
Grade 7 Collecting, organizing, summarizing and using data in PowerPoint.
Data cycle, what is data, sources, examples, keywords - data, population, sample, questionnaires & questions, raw data, frequency table, tallies, intervals, range of data values, completing tables, stem-and- leaf method, exercises, maths percentages, working with intervals, summarizing data - mode, median, bi-mode, mean, measures of dispersion, range, central tendency, formula for mean, measuring dispersion. Excellent for classroom teaching wit a data projector & for use on a mobile.
Subjects:
Grades:
6th - 8th, Not Grade Specific
Also included in: Grade 7 Maths Data handling in animated PowerPoint.
Showing 1-24 of 64 results


