168 results
Not grade specific graphing microsofts
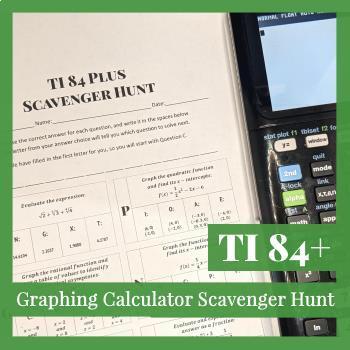
Graphing Calculator Lesson and Activity for the TI-84 Plus
Graphing Calculator Scavenger Hunt for the TI-84+ Start the year off right! With this ready-to-go lesson, you can teach the foundational calculator skills students will need in all of their math classes in just 1-3 days. Topics include:Evaluating ExpressionsRadicals (Square Roots, Cube Roots, etc.)Fractions vs. DecimalsScientific NotationDegrees vs. RadiansGraphing Linear FunctionsGraphing Quadratic FunctionsGraphing Rational FunctionsFinding x-Intercepts/RootsFinding the VertexFinding Vertical
Subjects:
Grades:
Not Grade Specific
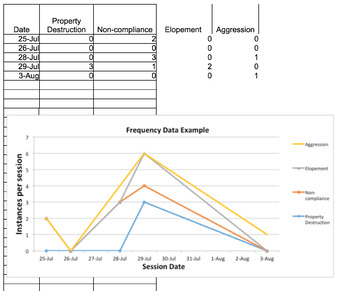
Graphing Basic Applied Behavior Analysis Data
This is a great resource for students or teachers that are new to learning how to graph frequency data (e.g., instances of aggression), accuracy data (e.g., % of correct sight words), baseline and treatment data, along with a few more. Each tab contains an example of data that is entered, as well as a (labeled) graph to accompany that data. It is very easy to edit and can be used to graph a multitude of different types of data. It is also a wonderful resource for therapists and other clinicians
Subjects:
Grades:
Not Grade Specific
*Digital Student DATA / Personal Binder Google Sheets hybrid - virtual - Zoom
Completely ***EDITABLE***Using student data binders encourages students to take ownership of their data. It is simple and easy to use this student binder and a wonderful way for students to have data chats at their Student Led Conferences. This Ultimate Student Data Binder is what you need to get started this year! Use this with your students in the classroom or virtually. Works great with Google classroom and zoom! No more graphing in a binder and printing out hundreds of papers for their binde
Subjects:
Grades:
Not Grade Specific
Types:
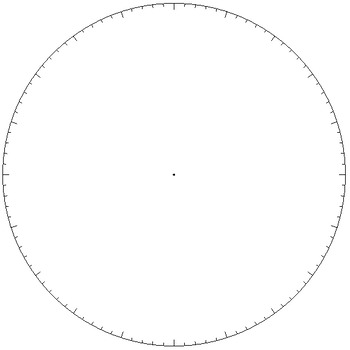
Pie Chart / Circle Graph - Simple Template
Pie graphs can be tricky to make by hand when the sections aren't easy fractions of the pie. This simple template gives a circle marked off with 100 'tick lines' for easy graphing of percentages of the whole pie. A second template using dots is included too. A dot in the centre of the circle is included too, making it easy to use a ruler and draw lines out to the edge.
It's a .docx (Word) file containing two images. Feel free to copy, paste, modify, distribute, embed...
~CalfordMath
If
Subjects:
Grades:
Not Grade Specific
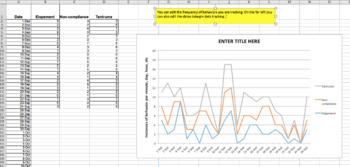
More Graphs Added! Graphing Basic Data For Students: An Excel Workbook
This is a great resource to use for data tracking for all of your students or clients. I have expanded the other Graphic Workbook on my TPT store. This resource is made to easily create graphs for a variety of skills or behaviors. As a result, this excel workbook can be used by teachers, behavior analysts, speech therapists, behavior intervention specialists, really anyone who needs data collection. The graphs can be shared during parent-teacher conferences, IEP meetings, included in student pro
Subjects:
Grades:
Not Grade Specific
Types:
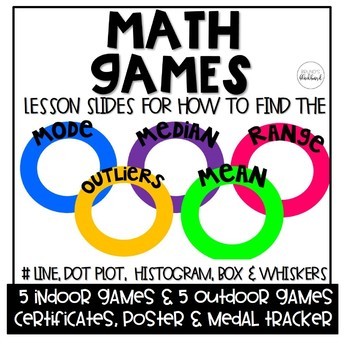
Math Games: Mean, Median, Range, Outliers & Graphs
Math Games
Students will learn how to find the mean, median, mode, range, range playing Olympic style games while practicing and creating Number Lines, Box Plot, Histograms and Box and Whiskers graphs.
This product is a zip file that contains a PowerPoint teaching how to find the mean, median, mode, range, outliers, number plot, dot plot, histogram, box and whiskers, 10 games and an editable create your own game. As well, a PDF file which has posters, awards and placing ribbons. Plus, 2 folda
Subjects:
Grades:
Not Grade Specific
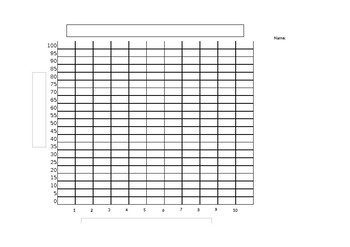
Blank (line or bar) Graph
This product can be for multiple uses! It contains a numbered x and y axis, a blank heading for students to write in a title, and blank headings for axis labels.I used the blank graph for my students to graph their test scores and then mark their goal for their next test creating an accountability factor for testing.
Grades:
Not Grade Specific
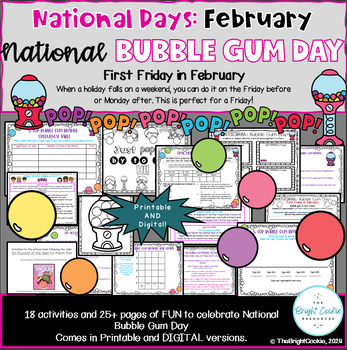
National Bubble Gum Day: Feb. 2nd- Differentiated Math and Engaging Activities
National Bubble Gum Day is celebrated on the first Friday of every February. What a great way to implement some academics AND ENGAGING FUN by using this National Bubble Gum Day resource that provides 18 activities with 25+ pages in all. Both printable and digital versions are provided for most activities. Additional resources with the picture book companion: On the Account of the Gum by Adam Rex)This resource includes: · What is National Bubble Gum Day? Page· Bubble Gum Timeline page· World Rec
Subjects:
Grades:
Not Grade Specific
Types:
Also included in: February National Days: BUNDLE- Engaging and Differentiated FUN!
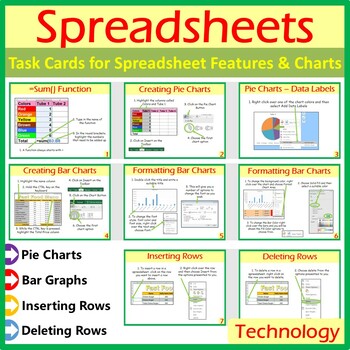
Microsoft Excel Spreadsheet Features & Chart Task Cards Help Cards
A wonderful set of 8 task/instruction cards which can be printed and laminated and then given to students to help them learn and practise the following features in Microsoft Excel:• =sum()• Creating pie charts• Inserting data labels on pie charts• Creating bar charts• Formatting bar charts• Inserting rows in spreadsheets• Deleting rows in spreadsheetsOther Microsoft Excel Products Available:• Microsoft Excel Bundle 1: Click Here• Microsoft Excel Bundle 2: Click Here• Grades 1- 4: Microsoft Excel
Grades:
Not Grade Specific
Types:
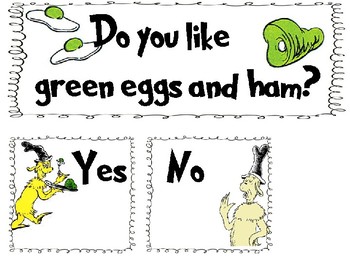
Green eggs & Ham Answer Cards
Comes with a headliner and yes/no cards. Each yes/no card has a space where a child can write their name. These are great for class graphs/prediction charts and more. These are not currently digitally editable. This is for personal use only. For questions or tor request a custom listing, please email page394creations@yahoo.complease note that the clipart used in this product is the sole property of their original creator. I do not own, nor do I claim copyright to any of the images used in this p
Subjects:
Grades:
Not Grade Specific
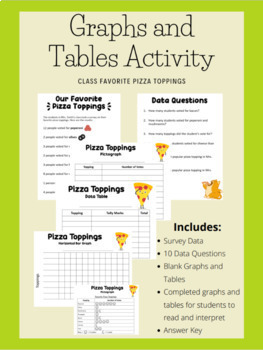
Favorite Pizza Toppings - Graphs and Tables
This is a great resource to help students learn how to read and interpret data in graphs and tables, as well as represent data in graphs and tables. The activity is adaptable to fit what you are working on with your students. It is appropriate for grades 2nd-4th, as well as special education students working on graphs and tables.This activity includes:-written data from a survey on favorite pizza toppings-blank pictograph, data table, vertical bar graph, and horiztonal bar graph-completed pictog
Subjects:
Grades:
Not Grade Specific
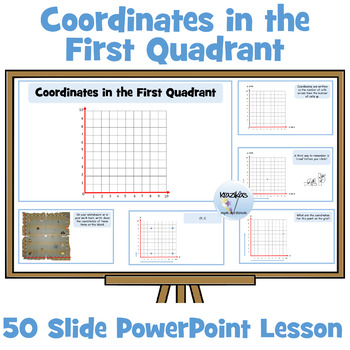
Coordinates in the First Quadrant
This is a highly visual and interactive 50-slide PowerPoint lesson on coordinates in the first quadrant. The PowerPoint explains and visually demonstrates the following:gridsx and y axesthe originhow to locate coordinateshow to plot coordinateshow to write coordinatesOpportunities are provided within the PowerPoint for students to locate and plot coordinates.You may also be interested in:Coordinates in the First Quadrant Differentiated WorksheetsThis resource is a set of 24 differentiated worksh
Grades:
Not Grade Specific
Types:
Also included in: Coordinates in the First Quadrant
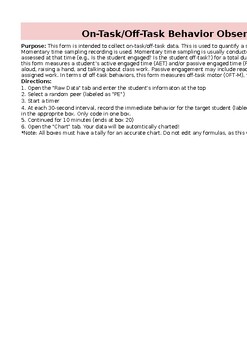
Behavior Observation Academic Engagement and Time on Task (BOSS) AUTO GRAPH
This form is intended to collect on-task/off-task data. It will AUTO graph. This is used to quantify a student's academic engagement and off-task behaviors. Momentary time sampling recording is used. This form measures a student’s active engaged time (AET) and/or passive engaged time (PET). In terms of off-task behaviors, this form measures off-task motor (OFT-M), verbal (OFT-V), and passive behaviors (OFT-P). EXCEL DOCUMENT.
Subjects:
Grades:
Not Grade Specific
Graphed Behavior Data Spreadsheet (Pre-Dated 2023-24 School Year)
Easily Graph student behavior data with this pre-formatted Excel spreadsheet. Simply enter the students' data in the spreadsheet and the document creates a colorful data graph. There is a spreadsheet and data graph pre-populated for each weekday of the 2023-2024 school year.
Subjects:
Grades:
Not Grade Specific
Types:
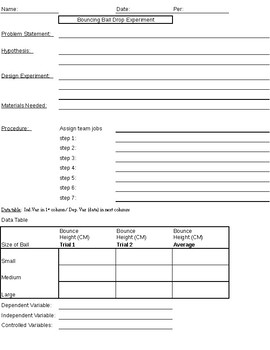
Science: Simple Bouncing Ball Experiment With Data Table & Graph Practice
This simple experiment can be used in open inquiry by giving students three different sized balls and a meter stick so they can design their own experiments. Included (all black & white pages - easy to copy): (1) teacher reference page to give students much or little guidance.(2) pages for students to write a problem statement, hypothesis, experiment design, materials needed, procedure, data table (for independent and dependent variables), an area for a graph, and conclusion. Some Ideas F
Subjects:
Grades:
Not Grade Specific
Types:
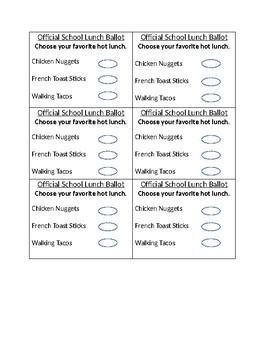
Editable Election Lunch Ballot
This is an editable Election Ballot that can be used as a fun school wide activity while learning and participating in an election. Teachers can facilitate or an upper grade could facilitate and it could be an project.
Subjects:
Grades:
Not Grade Specific
Types:
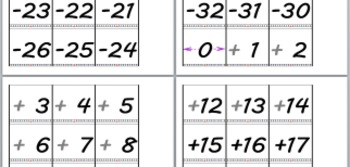
Numberline Positive Negative Integers -32 to +32 number line bulletin board size
FINALLY! A decent number line for teaching positive and negative numbers and beginning addition and subtraction of integers. Really, this is the bomb. I have used it.
Simple but not too simple, big enough to see, enough numbers to help learn to add and subtract, but not enough to take up all the wall space you have. Print and cut into rows of three numbers each.....then just tack them up. All done!
Comes with a sign about how signs interact in operations.
This is a large font posi
Grades:
Not Grade Specific
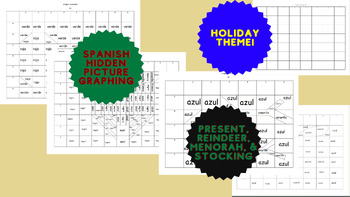
Spanish Holiday Graphing - Hidden Pictures
Fun way to incorporate Math into Spanish class and celebrate the holidays all in one!The students use the page with the words to complete the blank page and find the hidden picture! This set includes: #1 - menorah #2 - present#3 - stocking#4 - reindeer
Subjects:
Grades:
Not Grade Specific
Types:
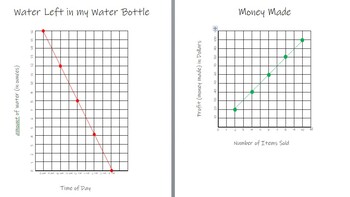
Linear Graphs Simplified for Special Education
I was in need of simplified graphs for my special education students. I made these up so they could learn the content with information relevant to their lives. This document includes ideas on how to teach the following concepts: x- and y- coordinates, covariation, direction of covariation, and rate of change. It includes nine original graphs with plotted points, the same graphs blank for your own graphing, graphs to discuss the direction of covariation, multiple choice worksheets for each gra
Subjects:
Grades:
Not Grade Specific
Types:
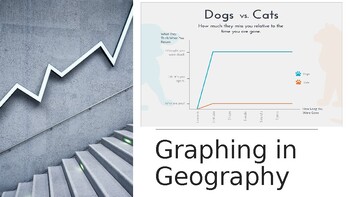
Graphing in Geography (3 different types)
Students will learn how to to put data into 3 different types of graphs (X/Y Scattergraph, Pie Chart, and Proportional area graphs with examples and a final task.
Subjects:
Grades:
Not Grade Specific
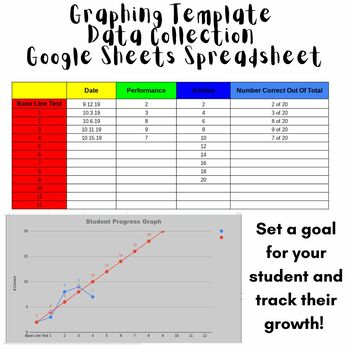
Data Collection Graph Template - Great for IEP GOALS!
Organize your data for students GOALS! Great way to TRACK and show GROWTH for progress monitoring with IEP GOALS, or really...any goals your students have! This is a spreadsheet set up for google sheets. All you need to do is enter the students information, their goal, and start tracking! Enter each time you test a student how they do, and a graph will be generated.
Subjects:
Grades:
Not Grade Specific
Types:
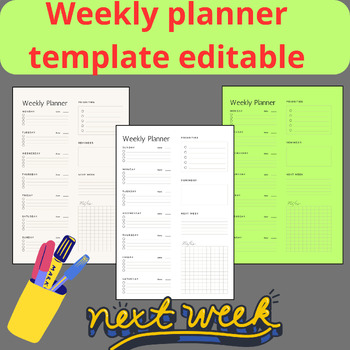
Weekly planner template editable _ Editable daily weekly teacher planner digital
The weekly planner template is a useful tool for organizing and managing tasks, appointments, and activities throughout the week. This editable weekly planner template provides the flexibility to customize and adapt the design to suit your specific needs and preferences. Here is a description of a typical editable weekly planner template: 1. Layout: The template usually features a clean and organized layout with the days of the week arranged horizontally from Monday to Sunday. 2. Editable Fi
Subjects:
Grades:
Not Grade Specific
Types:
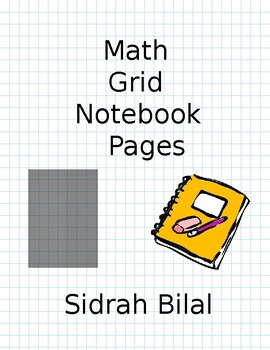
Math Grid Notebook For School Editable
Math Grid Notebook for School EditableKids can learn number writing, addition, subtraction and multiplication.Hight school students can use it for graph, Coordinates etc.Size = Letter size 8.5" X 11"With and without margin.Black and white and in blue color.Ask me I will change the color.
Grades:
Not Grade Specific
Types:
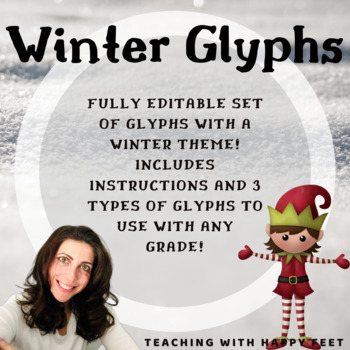
Winter Themed Holiday Glyphs
These themed holiday glyphs include an elf, snowman, and reindeer. Use these glyphs as a single lesson on data collection, or refer back to them again and again. These engaging glyphs address skills like following instructions, collaboration, data collection, and analytical skills. Whether you are a seasoned vet with glyphs or trying them for your first time these FULLY CUSTOMIZABLE glyphs can be altered to fit the needs of any class or grade.
Subjects:
Grades:
Not Grade Specific
Showing 1-24 of 168 results


