
Skittle Statistics MS Excel Mini-Lab


- Zip
- Excel Spreadsheets
- Webquests
- Easel Activity
- Easel Assessment
Also included in
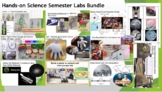 Are you looking for a bundle of affordable STEM labs for your science class? This bundle has 38 files worth of field tested labs. All include materials list, worksheets, and field pictures! You can cover earth science, chemistry, biology as well as other topics with this package. The bundles coverPrice $107.28Original Price $153.25Save $45.97
 This physics bundle is perfect for a semesters worth of physics! find out how to outrace zombies, play with slinkies, or calculate soundwaves! This full bundle combines my best hands-on labs into a full field tested bundle for your school year!This bundle is 10% off the total price!Price $58.50Original Price $70.75Save $12.25
 Chemistry is taught as a 2D flat part of the periodic table, but in truth it's 3D and interactive! This bundle is a whole semesters worth of chemistry!It includes 3D printable labs, class sized periodic tables, and hands-on labs for real learning!A full bundle here is at a 10% discount from full priPrice $49.73Original Price $60.50Save $10.77
Description
This is a 1 class MS Excel lab for a computer or math class. You can have the students explore the distribution of different color Skittles in class. This is a great mini-lab or half-day activity when you school ends up with a weird schedule day.
Tell them they can't eat till the Skittles till the end of class, or they will distort their numbers. Also make sure they don't throw them or shove them up their nose (Yes, stuck Skittles are hard to extract, ask me how I know..)
The goal of this lab is to practice excel, as well as programing the =SUM & =AVG function. They also build a simple clustered column chart. This is a fun way to build excel graphing skills.
This file has the full lab, and excel template you can use to produce the class graph.
I went to a bulk store and purchase a large 5 lb bag of skittles for this lab. You can use this with smaller bags, or vary the results with snack bags from Halloween assortments.
Easel Activity & Assessment
You can assign this as an activity for students devices in class, or as a make-up assignment from home.
The Assessment provides a great exit ticket!
Answer Key
In the ZIP file is the included Answer Key for your reference!
