70 results
High school statistics teacher manuals for Microsoft OneDrive
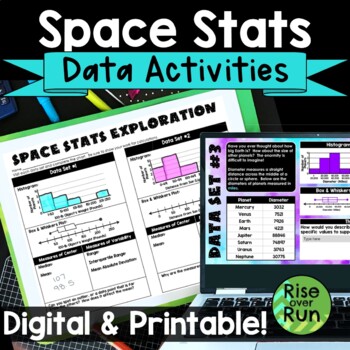
Box and Whiskers Plots and Histograms Activity with Real World Space Statistics
Use statistics for a real world application with this engaging activity about space stats! Students use real data to create histograms, box and whiskers plots, as well as calculate median, mean, range, interquartile range, and mean absolute deviation. This lesson works great for a space room transformation if you choose! Components are included in printable versions for in-person learning and Google Slides + Microsoft PowerPoint for online learning.Here’s what is included:Intro Presentation (Po
Subjects:
Grades:
6th - 9th
Types:
Also included in: Algebra 1 and 8th Grade Math Curriculum Bundle for Entire Year
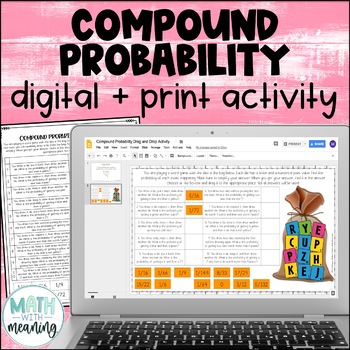
Compound Probability Digital and Print Activity for Google Drive and OneDrive
Looking for an engaging, no-prep activity to practice finding the probability of compound events? Students will use the included image to find the probability of 10 compound events, including both independent and dependent events. They will then find their answer from the answer choices at the bottom and drag it to the appropriate spot. Please view the preview file to make sure that this activity is appropriate for your students.This product includes the following:A link to the digital activity
Subjects:
Grades:
6th - 9th
CCSS:
Also included in: Middle School Math Digital and Print Activity Bundle Volume 1
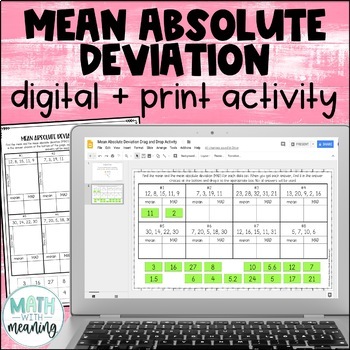
Mean Absolute Deviation MAD Digital and Print Activity for Google Drive
Looking for an engaging, no-prep activity to practice finding the MAD? Students will find the mean and mean absolute deviation for 8 data sets. They will then then find their answer from the answer choices at the bottom and drag it to the appropriate spot. Each data set contains 4-5 numbers. The mean of each data set is a whole number. Please view the preview file to make sure that these types of problems are appropriate for your students.This product includes the following:A link to the activit
Subjects:
Grades:
6th - 9th
CCSS:
Also included in: Middle School Math Digital and Print Activity Bundle Volume 2
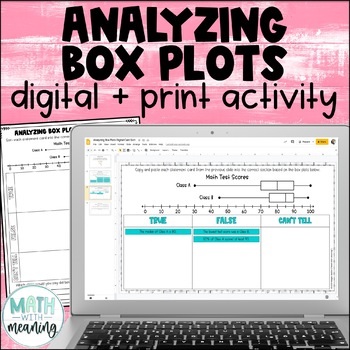
Box and Whisker Plot Digital and Print Card Sort - Reading and Analyzing
Looking for an engaging, no-prep activity to practice reading and analyzing box plots? Students will look at a double box plot and determine if statements about it are true, false, or if they can't tell from the information given in this fun digital and print activity.This activity includes statements about the minimum, maximum, median, quartile 1 (Q1), quartile 3 (Q3), interquartile range (IQR), and range of the box plots, along with statements about the percentages represented by a particular
Subjects:
Grades:
6th - 9th
Also included in: Middle School Math Digital and Print Activity Bundle Volume 3
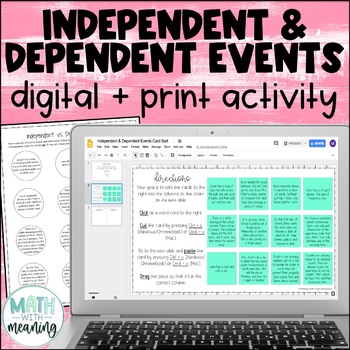
Independent and Dependent Events Digital Print Card Sort - Compound Probability
Looking for an engaging, no-prep activity to practice identifying independent and dependent events? Students will read 12 sets of compound events and determine if they are independent or dependent events. Many examples of real-world events are included. This is a great activity for students learning compound probability who struggle with differentiating between independent and dependent events. Also included is a printable graphic organizer that is perfectly sized for interactive notebooks. Plea
Subjects:
Grades:
6th - 9th
CCSS:
Also included in: Middle School Math Digital and Print Activity Bundle Volume 2
AP Statistics Exam Study Guide AND Key
Teacher AND Student Editions of AP Statistics Exam Study Guide! This 30-page comprehensive fill-in-the-blank study guide for AP Statistics will be the cornerstone of your AP Exam review! Broken down into 14 digestible sections, this study guide covers all the topics and skills your students will need to know for the AP Statistics Exam. Teachers all around the country ask for this study packet every year! I typically assign one section per night as homework, and discuss the section with students
Subjects:
Grades:
10th - 12th
Types:
Data Literacy in STEM & Digital Technologies | Numerical, Categorical & Digital
Enhance your student's understanding of DATA LITERACY and DIGITAL LITERACY What is Data? Why it's important? How do numerical, categorical, and digital data fit within STEM and DIGITAL TECHNOLOGIES?Well, look no further... This bundle contains everything you need to teach the essentials of DATA LITERACY with absolutely NO PREP REQUIRED.CoveringNumerical DataCategorical DataDigital DataData collectionData analysisData Sorting and FilteringData visualization and representationBinary, QR and more
Grades:
3rd - 10th, Adult Education, Staff
Types:
AP Statistics Exam Practice Problems AND Key
A whole packet choc-full of publicly-released, test-aligned questions to help your students prepare for the AP Statistics Exam - AND the answer key, which includes official scoring rubrics for each Free Response question! Multiple Choice solutions are also given, on the last page of the Answer Key. The perfect accompaniment to the AP Statistics Exam Study Guide, but also excellent as a stand-alone tool. Questions are divided into 14 topic-specific sections, each with 2-4 Multiple Choice and 1-2
Subjects:
Grades:
10th - 12th
Types:
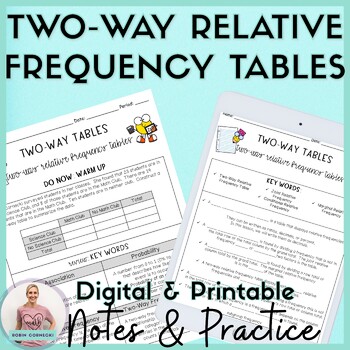
Two Way Relative Frequency Tables Guided Notes Practice HW 8th Grade Math
Two-Way Relative Frequency Tables Guided Notes is everything that you need to teach your middle school math students Constructing and Interpreting Two-Way Relative Frequency Tables. Students will also identify Joint Relative Frequency, Conditional Relative Frequency, and Marginal Relative Frequency through investigation and practice examples. These guided notes and practice worksheets are perfect for a binder or can be reduced in size to fit into an interactive notebook.✅This resource is pe
Subjects:
Grades:
7th - 9th
Types:
High School Math IEP Goal Bank - Statistics and Probability
This IEP goal bank was created to assist special education teachers with the task of writing standards-based IEP goals in math. After spending countless hours developing IEP goals myself and really having to think through how to best individualize goals and objectives for my own students, I wanted to share this resource to help other special education teachers gain back some of their time.This goal bank includes the following:An introduction and guide that explains how to use the document.Each s
Subjects:
Grades:
9th - 12th
CCSS:
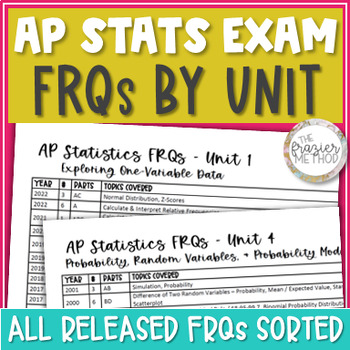
AP Statistics Exam FRQs / Released Free Response Questions Reference Sheet
AP Statistics Exam FRQs sorted by Units 1 to 9! For you to use all year long, the past exams' released free response questions have been organized by unit! Use this reference sheet to find FRQs for students to practice, review, or prepare for the AP Stats exam! Need a sub plan? Pull this out and quickly find an old FRQ for students to work on while you're out! Includes...List of all AP Stats Exam FRQs from 1998-2022 organized by unit.Directions for how to search for an FRQ on a specific topic.Li
Subjects:
Grades:
10th - 12th
Types:

IB Applications & Interpretations SL: Unit 7-Quantifying Uncertainty-Probability
IB Applications & Interpretations SL, Unit 7 - Quantifying Uncertainty - Probability, Binomial and Normal Distribution.This bundle includes 7 guided notes lessons, teacher guides for each day, 2 assessments and assessment reviews (lessons 6.1-6.3), an end-of-unit performance task, and an assignment sheet pacing guide, including recommended hw extra practice. Topics include:1) Basic Concepts of Probability and Counting2) Conditional Probability and the Multiplication Rule3) The Addition Rule4
Subjects:
Grades:
10th - 12th

IB Applications & Interpretations SL: Unit 3-Representing&Describing Data-Stats
IB Applications & Interpretations SL, Unit 3 - Representing and Describing Data - Descriptive Statistics.This bundle includes 7 guided notes lessons, teacher guides for each day, 2 assessments and assessment reviews (lessons 3.1-3.3, and 3.1-3.6), and an assignment sheet, including recommended hw extra practice. Topics include:1) Types of data2) Measures of central tendency3) Measures of variation4) Sampling techniques5) Presenting data6) Bivariate data
Subjects:
Grades:
10th - 12th

IB Applications & Interpretations SL: Unit 6 -Modeling Relationships - Bivariate
IB Applications & Interpretations SL, Unit 6 - Modeling Relationships - Linear Correlation of Bivariate Data.This bundle includes 5 guided notes lessons, teacher guides for each day, 1 assessment and assessment review (lessons 6.1-6.3), an end-of-unit performance task, and an assignment sheet pacing guide, including recommended hw extra practice. Topics include:1) Piecewise Functions2) Scatterplots3) Correlation4) Line of Best Fit5) Interpreting the Regression Line
Subjects:
Grades:
10th - 12th
8th Grade Math: Statistics & Probability Linear Relations Frequency Tables Slope
This middle school math unit for Statistics and Probability (data management) includes detailed Google 3-part lesson plans, projectable lesson slides, activities, and assessments that correspond to the Common Core Math curriculum for 8th grade. This unit is part of our ENTIRE YEAR OF COMMON CORE MATH PACKAGE which includes all of our math resources for Grade 8th Grade."This unit is excellent! It provides simple to use lessons that cover Statistics and Probability and align to the common core sta
Subjects:
Grades:
7th - 9th
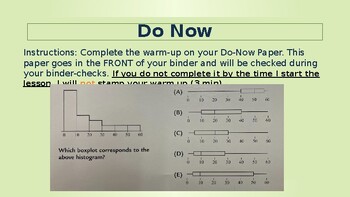
AP Statistics: Unit 1, Ch 2: Modeling Distributions of Data, Stats Medic Aligned
Hi! If you're following my series of PowerPoints for the Stats Medic curriculum, this resource is for you. The PowerPoint includes the ENTIRE sequence of activities, notes, and lessons aligned to Unit 1, Chapter 2: Modeling Distributions of Data in the Stats Medic curriculum for AP Statistics. The resource is a Microsoft PowerPoint, so feel free to edit the cadence of activities as you need. Each block is separated by a warm-up slide so you'll know when the PowerPoint ends for each class period
Subjects:
Grades:
11th - 12th, Higher Education
CCSS:
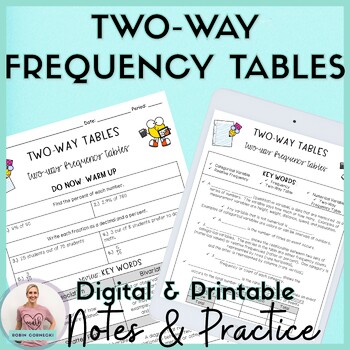
Two Way Frequency Tables Guided Notes Practice Homework 8th Grade Math
Two-Way Frequency Tables Guided Notes is everything that you need to teach your middle school math students about two-way tables and relative frequencies. Students will construct Two-Way Frequency Tables and decide whether there is an association through an investigation and practice examples. These guided notes and practice worksheets are perfect for a binder or can be reduced in size to fit into an interactive notebook.✅This resource is perfect for Distance Learning (zero prep) or in the cla
Subjects:
Grades:
7th - 9th
Types:
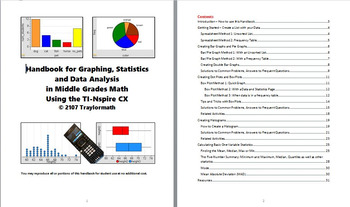
Graphing, Statistics & Data Analysis in Middle Grades Using TI-Nspire
This 30-page handbook ties together everything you need to use TI-Spire technology to teach middle school level data graphing and statistics. It will show you, step-by-step, how to create bar graphs, pie graphs, dot plot, box plots and histograms, and several methods for finding mean and quartiles, as well as an easy way to calculate Mean Absolute Deviation (MAD) with TI-Nspire. It also answers all those student questions about "why doesn't my graph look right?" Developed though several years of
Subjects:
Grades:
5th - 9th, Staff
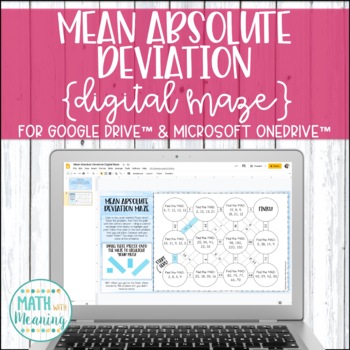
Mean Absolute Deviation DIGITAL Maze Activity for Google Drive Distance Learning
Students will practice solving problems involving mean absolute deviation with this fun digital maze activity! Students will end up solving a total of 10 problems.Each data set contains 4-6 numbers. The mean of each data set is a whole number. Please view the preview file to make sure that these types of problems are appropriate for your students.This product includes the following:A link to the activity on Google Slides including student directionsA PowerPoint version of the activity that can b
Subjects:
Grades:
6th - 9th
CCSS:
Also included in: Middle School Math DIGITAL Maze Activity Bundle for Google & OneDrive
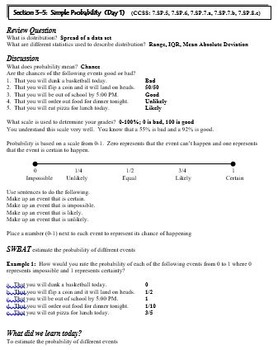
Statistics and Probability: Simple, Theoretical, Experimental, Probability
This is a 7 day lesson plan (powerpoint and hard copy) covering the topics of simple, theoretical, and experimental probability. Each lesson includes a review question, discussion, problems for teacher to model, and problems for the students to try. The lesson plan includes days of instruction, days of practice, assignments, and activities.
Subjects:
Grades:
7th - 9th
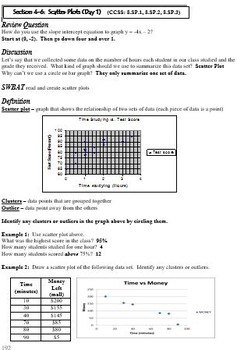
Statistics and Probability: Scatter Plots and Best Fit Lines
This is a 9 day lesson plan (powerpoint and hard copy) covering the topics of scatter plots and best fit lines. Each lesson includes a review question, discussion, problems for teacher to model, and problems for the students to try. The lesson plan includes days of instruction, days of practice, assignments, activities, and a project.
Subjects:
Grades:
7th - 9th
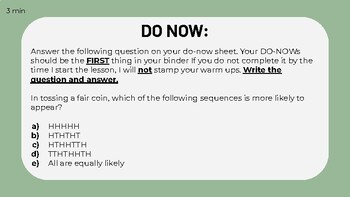
AP Statistics Unit 1: Ch1: Data Analysis Complete Lesson: StatsMedic Aligned
Hello! Are you a teacher that uses StatsMedic for AP Statistics? If you're like me and like to teach the lesson along with a powerpoint or tablet, this completed lesson guide will be useful for you! The PDF/PPT has time stamps for the activity, big idea content such as vocabulary, and practice problems to work on with your class. This lesson is specifically for all activities in StatsMedic related to Chapter 1: Data Analysis. For the complete UNIT 1 lessons (Chapter 1 and Chapter 2), check out m
Subjects:
Grades:
10th - 12th
CCSS:
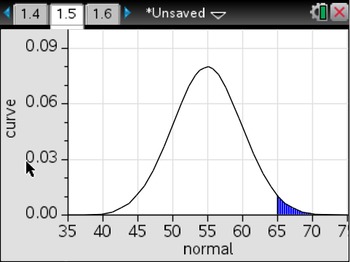
Normal Curve PDF: TI-NSpire Calculator Steps
This NSpire Calculator unit is designed for math department chairs, specialists, coaches, administrators, lead teachers, and classroom teachers. It contains ESSENTIAL information you need to cover Virginia SOL A.9 and AII.11 (Z-Scores, Standard Deviation, Normal Curve, Empirical Rule) properly.
Please enjoy. If you have any questions or comments, please do not hesitate to contact me at rturner31@gmail.com. I appreciate your feedback! Thanks for your purchase.
Subjects:
Grades:
7th - 12th
Types:
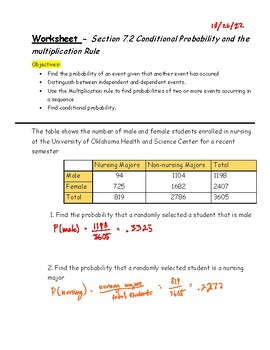
Teacher Guide - Lesson 7.2 - Conditional Probability and the Multiplication Rule
IB Applications & Interpretations SL: Teacher Guide for Guided Notes - Lesson 7.2
Subjects:
Grades:
10th - 12th
Types:
Showing 1-24 of 70 results


