397 results
High school statistics graphic organizers for Microsoft OneDrive
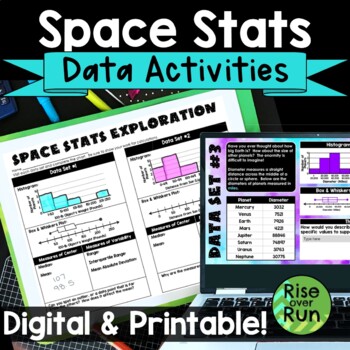
Box and Whiskers Plots and Histograms Activity with Real World Space Statistics
Use statistics for a real world application with this engaging activity about space stats! Students use real data to create histograms, box and whiskers plots, as well as calculate median, mean, range, interquartile range, and mean absolute deviation. This lesson works great for a space room transformation if you choose! Components are included in printable versions for in-person learning and Google Slides + Microsoft PowerPoint for online learning.Here’s what is included:Intro Presentation (Po
Subjects:
Grades:
6th - 9th
Types:
Also included in: Algebra 1 and 8th Grade Math Curriculum Bundle for Entire Year
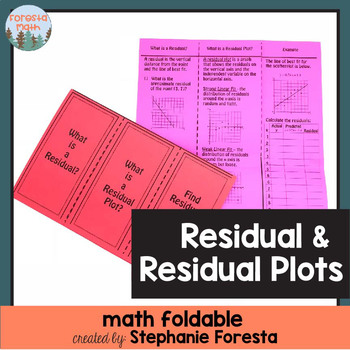
Residual & Residual Plots Foldable
A fun foldable to review or teach residuals and residual plots.
Subjects:
Grades:
7th - 10th
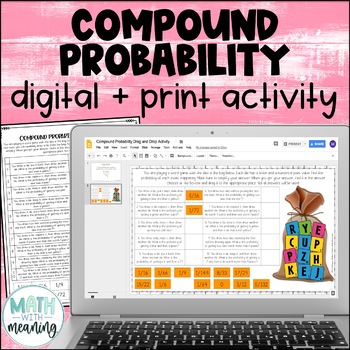
Compound Probability Digital and Print Activity for Google Drive and OneDrive
Looking for an engaging, no-prep activity to practice finding the probability of compound events? Students will use the included image to find the probability of 10 compound events, including both independent and dependent events. They will then find their answer from the answer choices at the bottom and drag it to the appropriate spot. Please view the preview file to make sure that this activity is appropriate for your students.This product includes the following:A link to the digital activity
Subjects:
Grades:
6th - 9th
CCSS:
Also included in: Middle School Math Digital and Print Activity Bundle Volume 1
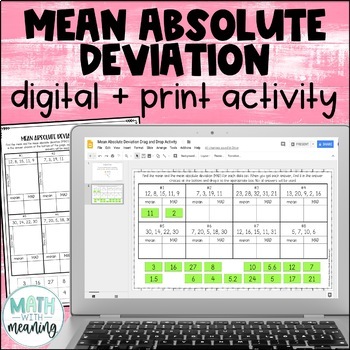
Mean Absolute Deviation MAD Digital and Print Activity for Google Drive
Looking for an engaging, no-prep activity to practice finding the MAD? Students will find the mean and mean absolute deviation for 8 data sets. They will then then find their answer from the answer choices at the bottom and drag it to the appropriate spot. Each data set contains 4-5 numbers. The mean of each data set is a whole number. Please view the preview file to make sure that these types of problems are appropriate for your students.This product includes the following:A link to the activit
Subjects:
Grades:
6th - 9th
CCSS:
Also included in: Middle School Math Digital and Print Activity Bundle Volume 2
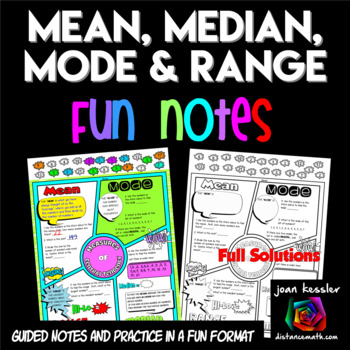
Measures of Central Tendency FUN Notes Doodle Pages
Your students will love learning the Measures of Central Tendency with these Fun Notes done in a comic book theme. Topics include Mean, Median, Mode, and Range. Students complete 6 problems plus definitions. There are two versions of the notes so you can differentiate. The PDF also includes 2 sizes, one standard 81/2 x 11" and the other in half size for INB's. Students love to doodle while learning and it has been shown that doodling and working with fun themed activities help students engage
Subjects:
Grades:
6th - 9th
Also included in: Algebra 1 FUN Notes Doodle Page Bundle
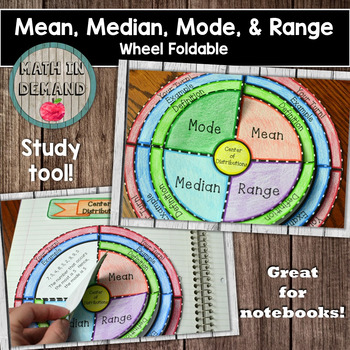
Mean, Median, Mode, and Range Wheel Foldable (Center of Distributions)
Students will construct a foldable on mean, median, mode, and range. There are 4 layers for the foldable: (1) Title, (2) Definition, (3) Example, and (4) Your Turn!. There is also a blank template included.
CLICK HERE to see my math foldables bundle!
CLICK HERE TO CHECK OUT MY VIDEO ON THIS FOLDABLE!
Subjects:
Grades:
5th - 9th
Also included in: Math Foldables Bundle (Includes All Math Wheel Foldables)
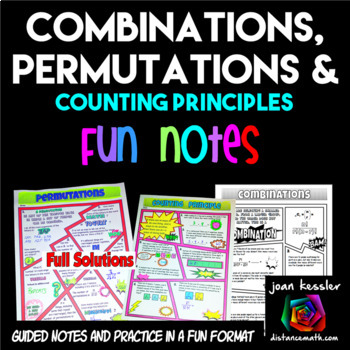
Permutations Combinations and Counting Principle FUN Notes Doodle Pages
Your students will love this Permutations, Combinations, and Counting Principle Fun Notes and Practice resource. Use it in class or as homework, assessment, or enrichment. A fun and engaging format for your students to learn the rules and practice their skills! Great for Algebra and Statistics.This resource contains 3 pages, one each for Permutations, Combinations, and the Fundamental Counting Principle. Students will complete a definitions and formula sections and complete over 20 problems.
Subjects:
Grades:
10th - 12th
CCSS:
Also included in: Algebra 2 FUN Notes Doodle Pages and Practice Bundle
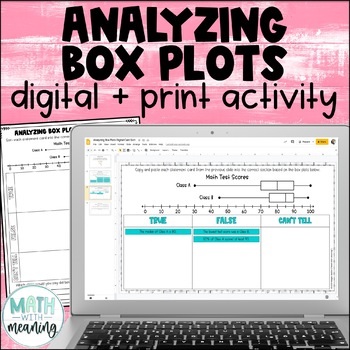
Box and Whisker Plot Digital and Print Card Sort - Reading and Analyzing
Looking for an engaging, no-prep activity to practice reading and analyzing box plots? Students will look at a double box plot and determine if statements about it are true, false, or if they can't tell from the information given in this fun digital and print activity.This activity includes statements about the minimum, maximum, median, quartile 1 (Q1), quartile 3 (Q3), interquartile range (IQR), and range of the box plots, along with statements about the percentages represented by a particular
Subjects:
Grades:
6th - 9th
Also included in: Middle School Math Digital and Print Activity Bundle Volume 3
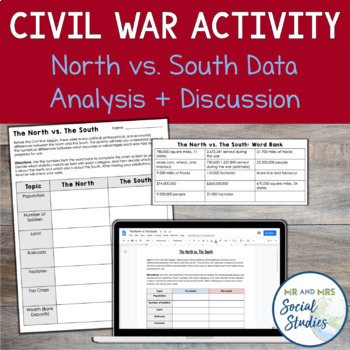
Civil War Activity | North vs South Statistics Activity and Worksheet
This no-prep American Civil War activity will help your students understand the differences between the North and the South...using data! If you need an activity to kick-off your Civil War unit or want a resource that highlights the differences between the North and the South, this is the resource for you! In this engaging activity, students receive a blank chart with many categories of data about the Civil War. Some of these categories include the population, the number of factories, and total
Grades:
7th - 10th
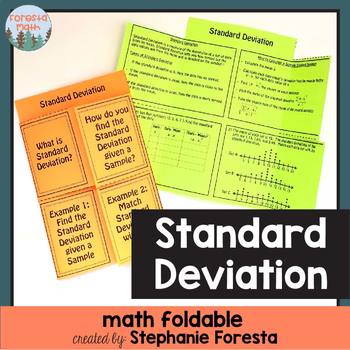
Standard Deviation Foldable
A fun foldable to teach or review finding the standard deviation of a sample. The foldable defines standard deviations, lists the steps to find standard deviation, and has two examples. The first example is a small sample that you can teach students how to find the standard deviation by hand. The second example has 3 standard deviations that must be matched with 3 dot plots by understanding the meaning of small and large standard deviations.
Subjects:
Grades:
7th - 10th
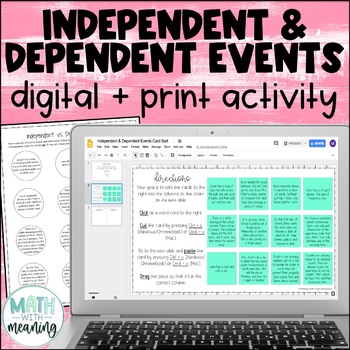
Independent and Dependent Events Digital Print Card Sort - Compound Probability
Looking for an engaging, no-prep activity to practice identifying independent and dependent events? Students will read 12 sets of compound events and determine if they are independent or dependent events. Many examples of real-world events are included. This is a great activity for students learning compound probability who struggle with differentiating between independent and dependent events. Also included is a printable graphic organizer that is perfectly sized for interactive notebooks. Plea
Subjects:
Grades:
6th - 9th
CCSS:
Also included in: Middle School Math Digital and Print Activity Bundle Volume 2
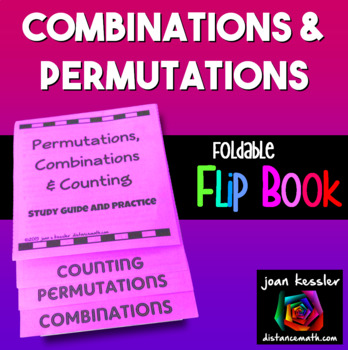
Permutations and Combinations Foldable Flip Book
This Flip Book includes guided notes and practice on Combinations, Permutations, and the Counting Principles.There are 19 problems for students to complete including a challenge problem on the back which is great for differentiation and early finishers. This makes a great study guide.The Flip Book is a perfect size for traditional or Interactive Notebooks, or just to use for studying for a test. Final size 4¼″ x 6½″. This is easy to make, no glue, no mess. Print one page double-sided, make one
Subjects:
Grades:
8th - 11th
CCSS:
Also included in: Algebra 1 Activity Bundle

Hypothesis Tests Introduction Statistics
My Statistics students always had trouble setting up the Null Hypothesis and the Alternative Hypothesis, and without understanding this, the tests and interpretations cannot be determined properly. Now I explain the unit and what Hypothesis Testing is all about first, and start them off with this set of notes and problems. At first they are excited not to do any math or calculations, but then the challenge begins.There are two sets of the problems, one multiple choice and the other mostly free
Subjects:
Grades:
9th - 12th
CCSS:
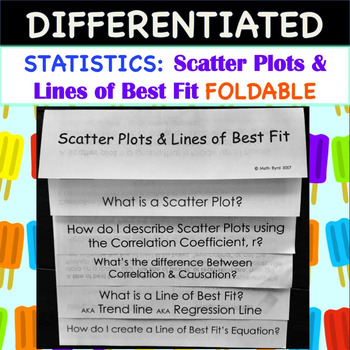
Statistics:Scatter Plots and Lines of Best Fit FOLDABLE
So Easy to Use! Simply print and fold! No need to rotate pages! Scatter Plots and Lines of Best Fit FOLDABLE also includes a PowerPoint to go along with the foldable.Foldable has 2 tiers of differentiation, perfect for the inclusive classroom! 1 set has fill-in-the-blank style notes within the foldable, while the other foldable has the notes already filled in. On both sets, students will have to work out the examples.Students will learn how to: Create Scatter PlotsDescribe Scatter Plots using Co
Subjects:
Grades:
8th - 11th
CCSS:
Also included in: Common Core Algebra 1: STATISTICS UNIT - BUNDLE PRICE!
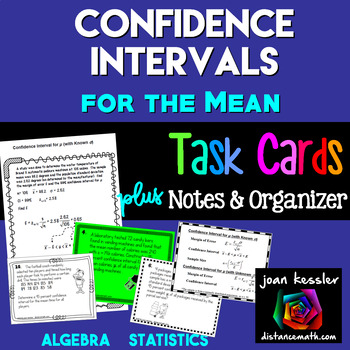
Confidence Intervals for the Mean
Your students will grasp Confidence Intervals for the Mean with this resource which includes Guided Notes, Task Cards, and a Graphic Organizer.What's Included?18 Task Cards for students to practice constructing confidence interval for the mean using the z - distribution and the t - distribution.Cards # 1 - 8 find Confidence intervals given statisticCards # 9 - 10 find Confidence intervals given dataCards # 11 - 12 find sample sizeCards # 13 - 15 find the margin of errorCards # 16 - 18 Given
Subjects:
Grades:
9th - 12th
CCSS:
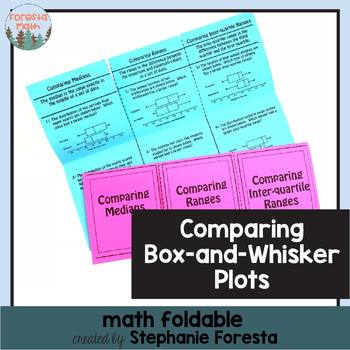
Comparing Box-and-Whisker Plots Math Foldables
A fun foldable to teach or review comparing medians, ranges, and inter-quartile ranges of two box-and-whisker plots.
Subjects:
Grades:
5th - 10th
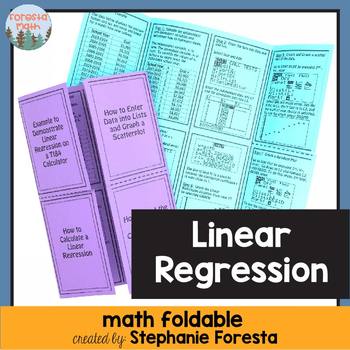
Linear Regression Foldable
A fun foldable to teach how to find the line of best fit, graph the line of best fit, find the correlation coefficient, graph a residual plot, and determine the goodness of fit.
The foldable was created using TI84's new operating system so if you haven't updated your calculators the instructions will not follow along exactly.
The foldable is completely filled in with instructions and images! It is a step by step tutorial for finding a linear regression on a graphing calculator.
Subjects:
Grades:
7th - 10th
Also included in: Functions Bundle
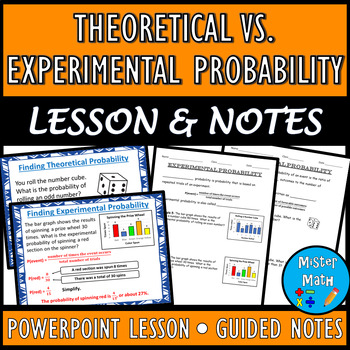
Theoretical vs. Experimental Probability PPT & Guided Notes BUNDLE
This BUNDLE includes a PowerPoint Lesson and a corresponding Guided Notes Packet to assist students in learning about theoretical and experimental probability. Students will learn the concepts of theoretical and experimental probability, as well as how to find the probabilities of each. Plenty of real-life examples are included to give students ample opportunities to practice the skills. Overall, the 21-slide PowerPoint and 6-page guided notes packet covers the following topics:Theoretical Proba
Subjects:
Grades:
6th - 9th
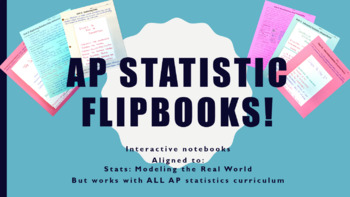
AP Statistics Flipbook Bundle! (Includes all objectives listed in 2019 CED!)
This resource has become a central focus of my class with overwhelmingly positive feedback from students, parents, and other teachers.
An interactive note page with "flipable" 3x5 cards summarizing the important data found in Bock, Velleman, De Veaux's (BVD) Stats: Modeling the World. This is applicable to ALL editions. May be used with all AP Statistics classes with minimum editing.
Included is an editable (word) document with the flipbook form (print on card stock for best results) and gradin
Subjects:
Grades:
10th - 12th
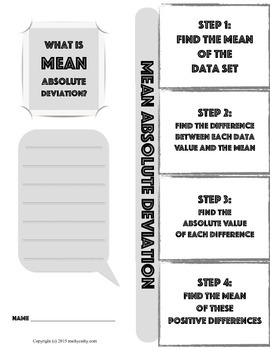
Mean Absolute Deviation Foldable Note-Taking Guide
This foldable will help make the process of learning how to calculate the mean absolute deviation of a data set easier to digest! In the new Texas TEKs, 8th grade students must be able to calculate the MAD of a small data set.
This foldable note-taking guide helps students take this process one step at a time. I encourage students to reference this structured example as they work more complex problems, and analyze the MAD of multiple data sets. This foldable guide is designed to get them s
Subjects:
Grades:
6th - 9th
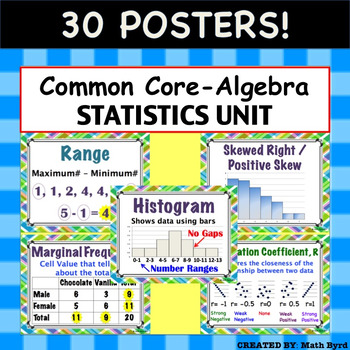
Common Core Algebra - Statistics Unit: Describing Data POSTERS
30 Posters! Each 8.5" x 11" in size. Posters are aligned with Common Core's Algebra - Statistics: Describing Data Unit. Posters Included:MeanMedianModeRangeInterquartile RangeOutlierMean Absolute DeviationMeasures of CenterMeasures of SpreadDot PlotHistogramBox PlotNormal/ Bell Shaped DistributionSkewed Right/Positive SkewSkewed Left/ Negative SkewUniform2 Way Frequency TableJoint FrequencyMarginal Frequency2 Way Relative Frequency TableConditional Relative FrequencyScatter PlotCorrelationCorrel
Subjects:
Grades:
8th - 11th
CCSS:
Also included in: Common Core Algebra 1 POSTERS - BUNDLE PRICE!
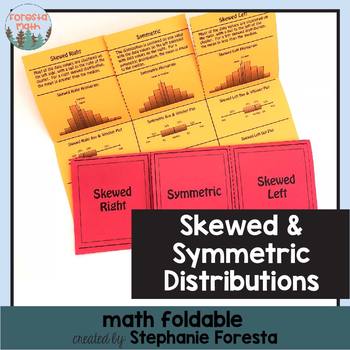
Skewed and Symmetric Distributions Math Foldable
A fun foldable with skewed and symmetric distributions (histograms, box & whisker plots, and line plots).
Subjects:
Grades:
7th - 11th
Types:
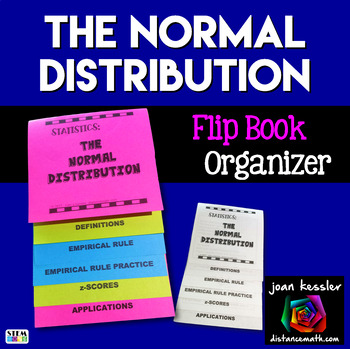
Normal Distribution Foldable Flip Book plus Practice
Your students will love this Normal Distribution Foldable Flip Book Organizer. Included are definitions, graphics, and 12 real life practice problems. Problems use both the Empirical Rule and z - scores. The problems that require z-scores use tables (included) or a graphing Calculator. The problems are challenging and will require your students to read carefully. I have also included a "cheat sheet" organizer for students' notebooks plus the tables (not part of flip book). Full solutions in
Subjects:
Grades:
9th - 12th
CCSS:
Also included in: Algebra 2 and PreCalculus Bundle of Foldables and Organizers
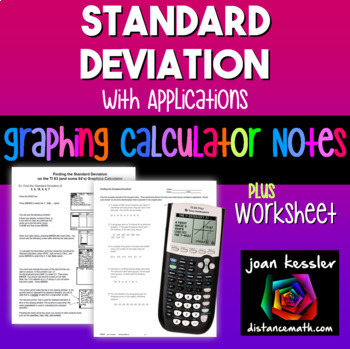
Standard Deviation on TI-84 Reference Sheets plus Practice
With this Determining the Standard Deviation on the TI 83 TI 84 Graphing Calculator plus HW step by step reference sheet your students will learn to use the graphing calculator effectively in finding the standard deviation from a data set. Use as Binder Notes or printed smaller for Interactive Notebooks.What's included?Two reference/handouts for students to learn how to find the Standard Deviation for both a population and for sample. One is for the TI 83 (yes, still in use) and the other for th
Subjects:
Grades:
8th - 11th
CCSS:
Showing 1-24 of 397 results


