198 results
High school statistics outlines for Microsoft OneDrive
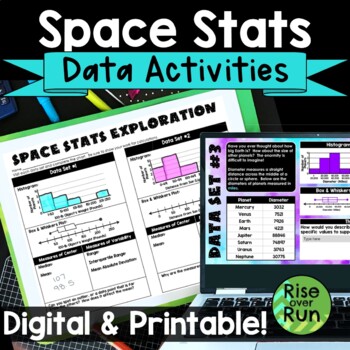
Box and Whiskers Plots and Histograms Activity with Real World Space Statistics
Use statistics for a real world application with this engaging activity about space stats! Students use real data to create histograms, box and whiskers plots, as well as calculate median, mean, range, interquartile range, and mean absolute deviation. This lesson works great for a space room transformation if you choose! Components are included in printable versions for in-person learning and Google Slides + Microsoft PowerPoint for online learning.Here’s what is included:Intro Presentation (Po
Subjects:
Grades:
6th - 9th
Types:
Also included in: Algebra 1 and 8th Grade Math Curriculum Bundle for Entire Year
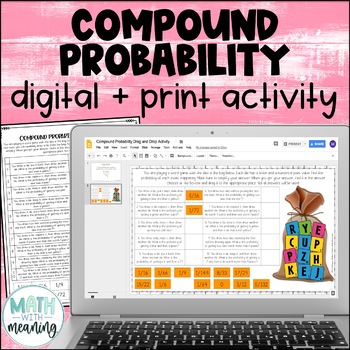
Compound Probability Digital and Print Activity for Google Drive and OneDrive
Looking for an engaging, no-prep activity to practice finding the probability of compound events? Students will use the included image to find the probability of 10 compound events, including both independent and dependent events. They will then find their answer from the answer choices at the bottom and drag it to the appropriate spot. Please view the preview file to make sure that this activity is appropriate for your students.This product includes the following:A link to the digital activity
Subjects:
Grades:
6th - 9th
CCSS:
Also included in: Middle School Math Digital and Print Activity Bundle Volume 1
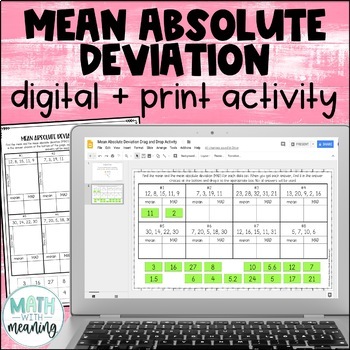
Mean Absolute Deviation MAD Digital and Print Activity for Google Drive
Looking for an engaging, no-prep activity to practice finding the MAD? Students will find the mean and mean absolute deviation for 8 data sets. They will then then find their answer from the answer choices at the bottom and drag it to the appropriate spot. Each data set contains 4-5 numbers. The mean of each data set is a whole number. Please view the preview file to make sure that these types of problems are appropriate for your students.This product includes the following:A link to the activit
Subjects:
Grades:
6th - 9th
CCSS:
Also included in: Middle School Math Digital and Print Activity Bundle Volume 2
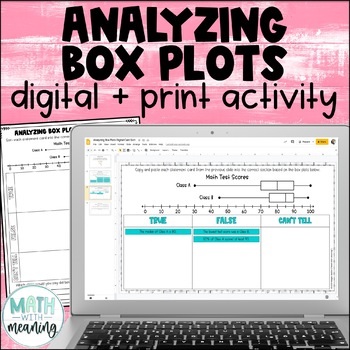
Box and Whisker Plot Digital and Print Card Sort - Reading and Analyzing
Looking for an engaging, no-prep activity to practice reading and analyzing box plots? Students will look at a double box plot and determine if statements about it are true, false, or if they can't tell from the information given in this fun digital and print activity.This activity includes statements about the minimum, maximum, median, quartile 1 (Q1), quartile 3 (Q3), interquartile range (IQR), and range of the box plots, along with statements about the percentages represented by a particular
Subjects:
Grades:
6th - 9th
Also included in: Middle School Math Digital and Print Activity Bundle Volume 3
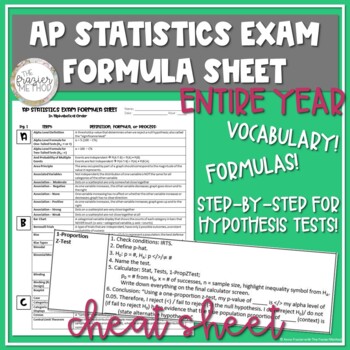
AP Statistics Review Vocabulary & Formulas for Entire Year, AP Stats Cheat Sheet
AN ENTIRE YEAR OF AP STATISTICS VOCABULARY, FORMULAS, & STEP-BY-STEP PROCESSES FOR CONFIDENCE INTERVALS AND HYPOTHESIS TESTS!!! Is AP Stats hard? Not with this all-in-one AP Statistics review of vocabulary, formulas, and step-by-step processes! Need some AP Statistics help? Use this product to help your students review for the AP Statistics Exam! This AP Statistics reference sheet includes definitions, formulas, and step-by-step processes for performing hypothesis tests and creating confiden
Subjects:
Grades:
9th - 12th
Types:
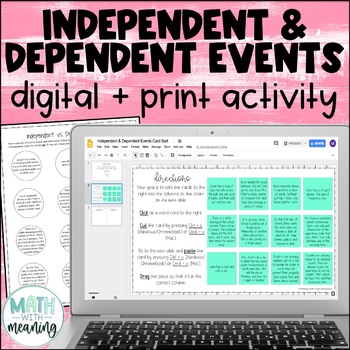
Independent and Dependent Events Digital Print Card Sort - Compound Probability
Looking for an engaging, no-prep activity to practice identifying independent and dependent events? Students will read 12 sets of compound events and determine if they are independent or dependent events. Many examples of real-world events are included. This is a great activity for students learning compound probability who struggle with differentiating between independent and dependent events. Also included is a printable graphic organizer that is perfectly sized for interactive notebooks. Plea
Subjects:
Grades:
6th - 9th
CCSS:
Also included in: Middle School Math Digital and Print Activity Bundle Volume 2
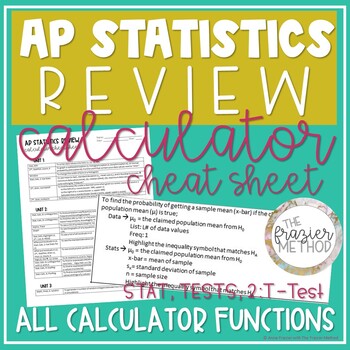
AP Statistics Review - Calculator Cheat Sheet for TI-84 Plus CE on AP Stats Exam
AN ENTIRE YEAR OF STATISTICS CALCULATOR FUNCTIONS for the TI-84 PLUS CE or TI-84 PLUS!!! Is AP Statistics hard? Not with this all-in-one AP Statistics calculator cheat sheet! Use this AP Statistics worksheet of calculator functions to help your students review for the AP Stats Exam! This AP Statistics reference sheet includes calculator functions from Units 1-7 - such as linear regression, probability formulas, graphs, re-expression, confidence intervals hypothesis tests, and more! This is a one
Subjects:
Grades:
9th - 12th, Higher Education
Types:
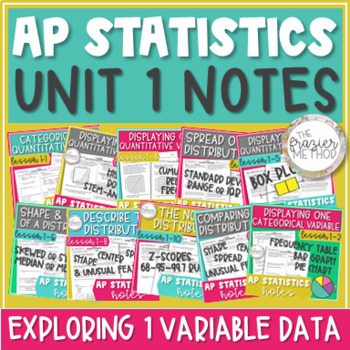
AP Statistics Notes Unit 1 Histogram, Box Plot, Skew, Mean, Normal Distribution
Use these AP® Statistics notes to teach UNIT 1 – EXPLORING ONE-VARIABLE DATA. Histograms, box plots, dot plots, stem-and-leaf plots, bar graphs, outliers, 5-number summary, z-scores, Normal Distribution / Normal Model, and describing a distribution's shape, center, & spread! Skewed or symmetric, median or mean, standard deviation or interquartile range... You can also use these notes for AP® Stats exam review! Aligns with the updated 2019-2020 objectives and standards of Unit 1: Exploring On
Subjects:
Grades:
10th - 12th
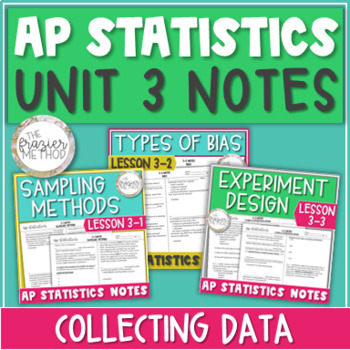
AP Statistics Notes Unit 3 Sampling Methods, Types of Bias, & Experiment Design
AP Statistics notes on SAMPLING METHODS : simple random sample, stratified sample, systematic sample, cluster sample, convenience sample... TYPES OF BIAS : undercoverage, nonresponse bias, response bias... and OBSERVATIONAL STUDIES & EXPERIMENT DESIGN : variables, treatments, control group, placebo, blocking, blinding, matched pairs, and more! Great for AP Stats Exam review! Aligns with AP College Board's updated 2019-2020 objectives and standards for AP Statistics Unit 3: Collecting Data. W
Subjects:
Grades:
10th - 12th, Higher Education
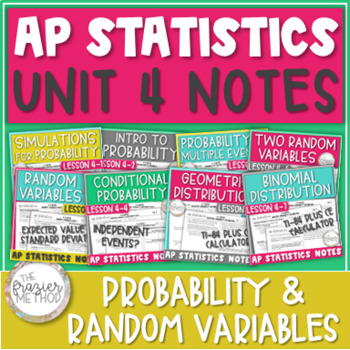
AP Statistics Notes Unit 4 Bundle - Probability Rules & Random Variables
AP Stats notes on PROBABILITY RULES : basic probability, complement, compound probability of multiple events, conditional probability, venn diagrams, simulations... RANDOM VARIABLES : expected value, standard deviation, sum and difference of two... and GEOMETRIC & BINOMIAL PROBABILITY DISTRIBUTIONS! Great for AP Statistics Exam review prep! Aligns with AP College Board's objectives and standards for AP Statistics Unit 4: Probabilities, Random Variables, & Probability Distributions. WHAT’
Subjects:
Grades:
10th - 12th
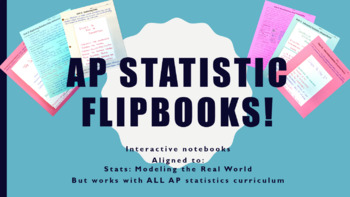
AP Statistics Flipbook Bundle! (Includes all objectives listed in 2019 CED!)
This resource has become a central focus of my class with overwhelmingly positive feedback from students, parents, and other teachers.
An interactive note page with "flipable" 3x5 cards summarizing the important data found in Bock, Velleman, De Veaux's (BVD) Stats: Modeling the World. This is applicable to ALL editions. May be used with all AP Statistics classes with minimum editing.
Included is an editable (word) document with the flipbook form (print on card stock for best results) and gradin
Subjects:
Grades:
10th - 12th
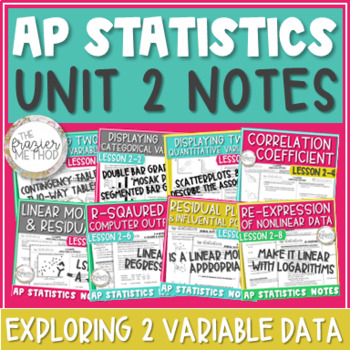
AP Statistics Notes Unit 2 Scatterplot Linear Regression Residual Two Way Table
AP® Statistics notes on UNIT 2 - EXPLORING TWO-VARIABLE DATA : contingency tables / two way tables, segmented bar graphs, scatterplots / scatter plots, correlation coefficient, linear models, residual plots, linear regression computer output, r-squared, and more! Great for AP® Stats Exam review prep! Aligns with updated 2020 objectives and standards for AP® Statistics Unit 2: Exploring Two-Variable Data. WHAT’S INCLUDED IN THIS PRODUCT?2-1 Notes - Contingency Tables2-2 Notes - Segmented Bar Grap
Subjects:
Grades:
10th - 12th
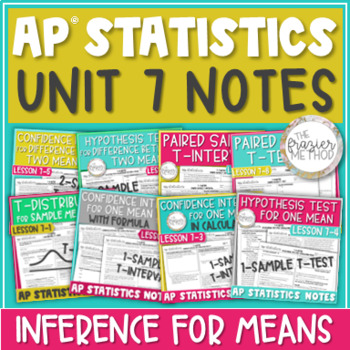
AP Statistics Notes Unit 7 Confidence Intervals & Hypothesis Tests for Means
8 AP® Statistics Notes on CONFIDENCE INTERVALS & HYPOTHESIS TESTS FOR SAMPLE MEANS. Through definitions, examples, and AP Stats FRQs, these notes teach through T-Distribution / T-Model, 1-Sample T-Interval, 1-Sample T-Test, 2-Sample T-Interval, 2-Sample T-Test, Paired Sample T-Interval, and Paired Sample T-Test. Each confidence interval and hypothesis test is taught by-hand with its formula and with its TI-84 Plus CE Calculator function. You can also use this bundle for AP® Statistics Exam p
Subjects:
Grades:
10th - 12th
Types:
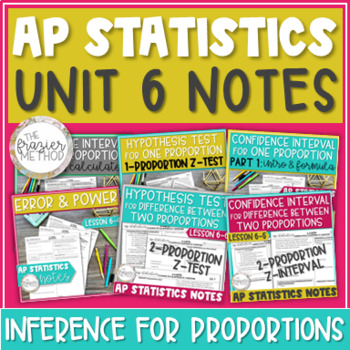
AP Statistics Unit 6 Notes Confidence Interval & Hypothesis Test for Proportions
AP Stats Notes on CONFIDENCE INTERVALS & HYPOTHESIS TESTS FOR PROPORTIONS! 1-Proportion Z-Interval, 1-Proportion Z-Test, Type 1 & 2 Errors, the Power of a Significance Test, 2-Proportion Z-Interval, and 2-Proportion Z-Test... each taught by-hand with its formula and with its TI-84 Plus CE Calculator function. Great for AP Stats Exam prep! Includes AP Stats FRQs! Aligns with AP College Board's updated 2019-2020 objectives and standards for AP Statistics Unit 6: Inference for Categorical
Subjects:
Grades:
10th - 12th
Data Literacy in STEM & Digital Technologies | Numerical, Categorical & Digital
Enhance your student's understanding of DATA LITERACY and DIGITAL LITERACY What is Data? Why it's important? How do numerical, categorical, and digital data fit within STEM and DIGITAL TECHNOLOGIES?Well, look no further... This bundle contains everything you need to teach the essentials of DATA LITERACY with absolutely NO PREP REQUIRED.CoveringNumerical DataCategorical DataDigital DataData collectionData analysisData Sorting and FilteringData visualization and representationBinary, QR and more
Grades:
3rd - 10th, Adult Education, Staff
Types:
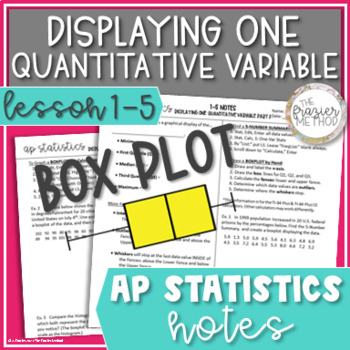
AP Statistics Notes Box Plot / Boxplot, Quartile, IQR, Outlier, 5 Number Summary
AP Stats notes to teach or review BOXPLOTS / BOX PLOTS / BOX-AND-WHISKER PLOTS! Define & calculate the median, interquartile range, 5-Number Summary, minimum, maximum, first quartile (Q1), third quartile (Q3), and percentiles for a set of data. Also, determine which data values are outliers based on the upper fence and lower fence of a boxplot. Students will graph box plots by hand given just a few of the data values and with step-by-step TI-84 Plus CE Calculator directions given the full li
Subjects:
Grades:
9th - 12th
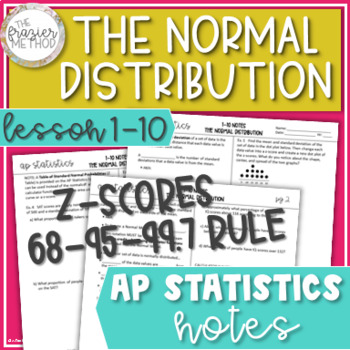
AP Statistics Notes Normal Distribution Z-Scores Empirical Rule Normal Model
Great AP Stats notes on the NORMAL DISTRIBUTION & Z-SCORES! Students will use the Normal Model and Empirical Rule (68-95-99.7% Rule) to find a data value, calculate z-scores, and find the area under the Normal curve using both the z-score formula and TI-84 Plus CE calculator functions. Students will also interpret z-scores in context, write the Normal Model notation N(µ, σ), and determine whether a data value can be considered “unusual.” Perfect for AP Stats Exam review prep! Aligns with AP
Subjects:
Grades:
9th - 12th
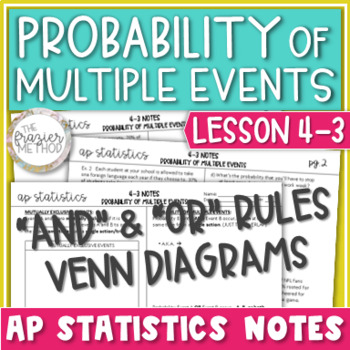
AP Statistics Notes Compound Probability of Multiple Events & Mutually Exclusive
AP Statistics notes on COMPOUND PROBABILITY OF MULTIPLE EVENTS / AND & OR PROBABILITY RULES with VENN DIAGRAMS and Mutually Exclusive Events! Students will define and calculate the probability of Events A AND B, the probability of Events A OR B, and the probability of an event’s complement. Students will also determine whether events are MUTUALLY EXCLUSIVE. Use these notes pages as AP Stats Exam review prep! Aligns with AP College Board's objectives and standards for AP Statistics Unit 4: Pr
Subjects:
Grades:
10th - 12th
Also included in: AP Statistics Notes Unit 4 Bundle - Probability Rules & Random Variables
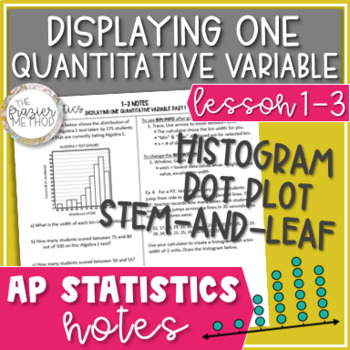
AP Statistics Notes Histograms, Dot Plots, & Stem-and-Leaf Plots - Data Displays
AP Stats notes to teach or review graphing and reading DOT PLOTS, STEM-AND-LEAF PLOTS, & HISTOGRAMS! Students will graph histograms using a TI-84 Plus CE Calculator and graph a dot plot and stem-and-leaf plot by hand. Practice problems and examples include answering questions about a set of data values displayed in a histogram. Great for AP Stats Exam prep! Aligns with AP College Board's updated 2019-2020 objectives and standards for AP Statistics Unit 1: Exploring One-Variable Data. WHAT’S
Subjects:
Grades:
9th - 12th
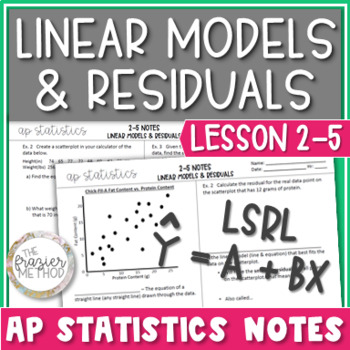
Linear Models & Residuals / Regression Line of Best Fit - AP Statistics Notes
AP Stats Notes on LINEAR MODELS & RESIDUALS. Write the equation of a linear regression model from a list of data values and use step-by-step TI-84 Plus CE Calculator directions to find the equation of the Line of Best Fit / Least Squares Regression Line (LSRL). With formulas and the regression equation, calculate residuals (e), predicated values (y-hat), y-intercept, & slope of the linear model. Templates for “interpret in context” questions are also included! Great AP Stats Exam prep! A
Subjects:
Grades:
10th - 12th
AP Statistics Notes - UNIT 5 BUNDLE - Sampling Distributions Proportions & Means
These AP Statistics notes will help you teach or review SAMPLING DISTRIBUTIONS FOR SAMPLE PROPORTIONS & SAMPLE MEANS! You can also use these notes pages to help your students review for the AP Statistics Exam! Aligns with AP College Board's objectives and standards for AP Statistics Unit 5: Sampling Distributions. WHAT’S INCLUDED IN THIS PRODUCT?5-1 Sampling Distributions of Sample Proportions2 Pages, Blank Pages & Answer KeyIntroduces sampling distributions and sampling distributions of
Subjects:
Grades:
10th - 12th
AP Statistics Notes Shape & Center of Distribution, Median Mean, Skew Symmetric
Here's AP Stats notes on SHAPE & CENTER OF A DISTRIBUTION – SYMMETRIC OR SKEWED, MEDIAN & MEAN! Calculate the median and mean from a list of data values and estimate the median and mean from a histogram, boxplot, stem-and-leaf plot, dot plot, and cumulative relative frequency plot. Determine which measure of center to use based on the shape of the distribution – skewed or symmetric. Other terms defined in these notes include sample, population, statistics with symbols, parameters with sy
Subjects:
Grades:
9th - 12th
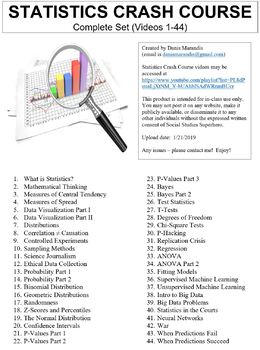
Crash Course Statistics Worksheets Complete Series Set Full Bundle Collection
This ZIP file contains Microsoft Word document worksheets (along with PDF versions) for each of the forty-four episodes of Crash Course Statistics hosted by Adriene Hill.Worksheets contain a combination of fill-in-the-blank and short answer questions. Each worksheet is accompanied with an answer key and relevant images.By purchasing this file, you agree not to make it publicly available (on external websites, etc.) or to share with any other teachers. It is intended for classroom use only. You *
Subjects:
Grades:
9th - 12th, Higher Education, Adult Education, Staff
Types:
AP Statistics Notes Conditional Probability Venn Diagrams & Independent Events
AP Statistics notes on CONDITIONAL PROBABILITY & INDEPENDENT EVENTS! Define and identify independent events, prove independence using P(B) = P(B|A), and calculate conditional probability from two-way tables. Aligns with AP College Board's objectives and standards for AP Statistics Unit 4: Probabilities, Random Variables, & Probability Models. WHAT’S INCLUDED IN THIS PRODUCT?Lesson 4-4: Probability Rules Part 3 – Conditional Probability & Independent EventsNOTES – 3 Pages, Blank Pages
Subjects:
Grades:
10th - 12th
Also included in: AP Statistics Notes Unit 4 Bundle - Probability Rules & Random Variables
Showing 1-24 of 198 results


